IDEX Online Research: August U.S. Jewelry Sales Bounce Sharply Higher
October 18, 05
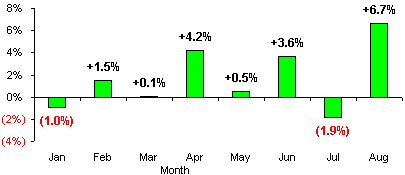
Specialty jewelers in America posted their strongest sales gains of the year during August, according to the U.S. Department of Commerce. Sales climbed by nearly 7% in August over the same month a year ago, as the graph below illustrates. In addition, the Department of Commerce adjusted total jewelry sales in July modestly upward, though the month still showed a decline from the prior year.
| U.S. Jewelry Sales Trends 2005 By Month - % Change Year-to-Year
|
IDEX Online Research confirmed these trends with independent jewelers in the U.S. Many jewelers reported “surprisingly” strong sales. However, aside from easy comparisons against extremely weak August 2004 jewelry sales, a survey of these merchants produced no single reason why jewelry sales were up. Diamond demand remains solid and the average ticket continues to rise modestly, according to many jewelers. However, consumers also bought colored stone jewelry as well as gold goods. Mall traffic was reported as “flattish.”
Jewelry retailers should use retail sales results as reported by IDEX to benchmark their own revenue gains. IDEX Online Research uses “not seasonally adjusted” numbers that closely represent “actual dollars through the cash register.” Most news services report “seasonally adjusted” numbers which cannot be used as a financial benchmark by merchants.
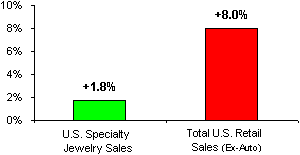
| Jewelry vs Retail Sales Year-to-Date 2005 vs 2004 |
Year-to-Date Jewelry Sales Weak
On a year-to-date basis, total U.S. jewelry sales in the U.S. are up very modestly – just under 2% -- while total retail sales (ex-auto) are up a solid 8%, as the graph illustrates. Clearly, jewelry has lost share-of-wallet with American shoppers.
IDEX believes that there are two key reasons for jewelry’s underperformance.
- Other retailers are out-promoting jewelers – Jewelers’ eternal 50%-off promotions have lost credibility. Further, other retailers have come up with innovative promotions. For example, the auto industry’s “employee discount” pricing created very strong demand for new cars during the late Summer and early Fall.
- Nothing new and compelling – Other than a few new diamond brands, there isn’t anything new in jewelry to capture shoppers’ attention. Tennis bracelets are pass?, the right-hand ring may finally be catching on but it will not represent a major diamond sales segment, and other categories such as gold, pearls, silver, and platinum have ho-hum product offerings.
As the graph below illustrates, jewelry sales have consistently under-performed total U.S. retail sales (ex-automobile sales) every month of 2005.
| U.S. Retail Sales Trends Retail Sales (Ex-Auto) vs Jewelry Sales Not Seasonally Adjusted (Dollars Thru the Cash Register) |
Mall Jewelers Outperform Non-Mall Independents
So far this year, mall jewelers have posted stronger sales gains than non-mall independent jewelers, as the graph shows. This trend is a reversal from the past two years, when non-mall jewelers’ sales were stronger. This latest trend – strong mall jewelry sales – comes even as consumer traffic in U.S. malls continues to relentless decline. Time-pressured shoppers don’t want to put up with the hassles of crowded mall parking lots and jam-packed malls, so they are increasingly shopping at strip centers where they can usually park in front of their favorite store, breezing in and out in just a few minutes.
Further, consumers perceive that mall retailers do not offer the same values that off-mall discounters offer. This helps explain why sales gains at mall retailers continue to lag total retail sales gains in the U.S.
| Mall Jewelry Sales vs Independents' Jewelry Sales 2005 by Month - % Change Y/Y |
Jewelers’ Sales Gains Lag Luxury Sector
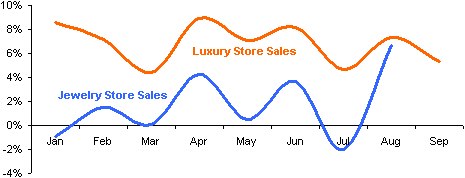
Luxury retailers in the U.S. – Saks, Nordstrom, and others – continue to generate stronger sales gains than aggregate gains for the jewelry industry, as the graph illustrates. Higher-end luxury retailers’ sales gains are the strongest. In the jewelry industry, for example, Tiffany & Co. and Mayor’s Jewelers have consistently generated stronger sales than most mass-market and popular-priced jewelers.
| Luxury Demand vs Jewelry Demand 2005 by Month - % Change Y/Y |
Jewelry Sales Soft Compared to Other Retail Categories & Segments
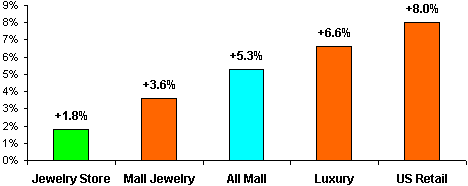
When year-to-date jewelry sales trends are compared to other retail segments, jewelry industry demand is clearly lagging, as the graph below illustrates. Total specialty jewelry sales in the U.S. are up a paltry 1.8% through August. In contrast, luxury goods retailers’ sales are up a very strong 6.6%. Further, mall jewelry sales lag total mall sales (GAFO* categories). Finally, U.S. retail sales year-to-date remain much stronger than jewelry sales.
| Retail Sales Trends |
A Look Ahead – Stronger Comparisons
Was the August 2005 jewelry sales gain an aberration? Not likely. August 2004 jewelry sales were particularly week (see graph below), so August 2005 sales comparison were especially easy. Monthly sales comparisons for the next several months are relatively easy for U.S. jewelers, primarily because of very weak sales in the second half of 2004, as the graph shows. This mathematical quirk will make jewelry sales for the balance of 2005 look stronger than they really are. Thus, IDEX Online Research expects that sales trends for the balance of the year will show solid percentage gains, even if the dollar gains are more modest.
 Source: U.S. Dept. of Commerce |
*GAFO mall sales – general, apparel, furniture, and other hardlines and softlines. Food, restaurant, and services sales at malls are excluded.


