IDEX Online Research: Zale - Short Term Pain for Long Term Gain?
November 29, 05
There’s an old adage that “you can’t turn a battleship around on a dime.” Despite a lot of hard work by Zale’s management over the past three years, the Zale team is proving that this old adage is correct.
Recent Results Disappointing
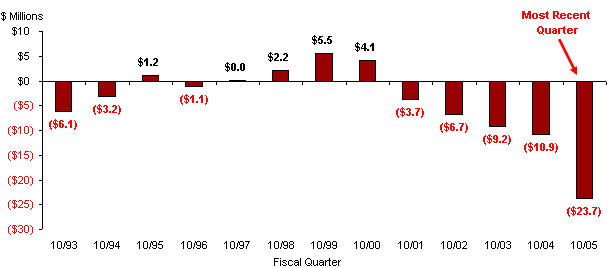
Zale’s normal seasonal loss for the October 2005 quarter increased. This is the second consecutive quarter in which profits have either been diminished or losses have been greater. Sales are weak. Margins are down. Is this a trend? What is happening?
| Zale Corporation First Fiscal Quarter Ended October 2005
|
Because the third calendar quarter has no major events – such as Valentine’s, Mother’s Day, Christmas – which drive jewelry demand, it is usually the least important three-month period of the year in terms of sales and profits. However, the October quarter has not always been a loss period for Zale. For the four-year period from 1997 through 2000, Zale posted a modest profit in the October quarter. At that time, Zale became one of the few major jewelers in the U.S. to post a profit in all four quarters of the year.
| Zale Net Profit (Loss) - October Quarter |
Zale’s loss in the October 2005 quarter was driven by three factors:
- Weak sales – This continuing problem was exacerbated by some “modest” inventory out-of-stocks in the Zales Jewelers mass market division.
- Declining gross margin – Despite an increase in direct sourcing – which should add 40-50 basis points to margins annually – higher markdowns in the Bailey Banks & Biddle (BBB) and the Piercing Pagoda divisions hurt. In addition, there was a mix shift in the Piercing Pagoda division that hurt overall corporate margins. Finally, weak sales de-leveraged some relatively fixed costs that are included in cost of sales.
- Rising expenses – Several factors contributed to increased costs, including some unusual items such as an $8.4 million write-down for closing 30 BBB stores as well as stock option expense of $1.9 million and de-leverage of overhead costs. There was an offset: proprietary credit costs were lower.
There’s another old adage that says “strong sales cover a lot of sins.” While we can’t say that Zale has sins in the literal context of the word, we can say that Zale’s weak sales exposed margin and cost pressures. If sales had been strong in the October quarter, it is possible that there could have been significant leverage of expenses. But, when sales are weak, relatively fixed overhead costs are inefficiently absorbed. By definition, that yields a lower margin.
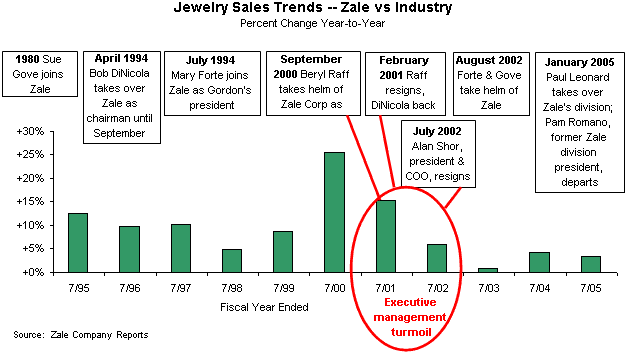
After many years of solid sales increases and market share gains, Zale has been plagued by weak sales and a declining market share for three years (see graph below). In their joint letter to shareholders (July 2005 Zale Corporation Annual Report), Mary Forte, president and CEO, and Sue Gove, executive vice president and COO, were candid: “Three years ago, we put a strategic plan in place that provided the framework and foundation to support the company’s long-term growth.” They acknowledged that there were some deficiencies: “While we did not reach all of our market share goals, we began to experience benefits from our growth strategy. Square footage and other growth accelerated over 3 percent in the fiscal year [ending July] 2005 as we opened 61 new stores, 50 kiosks, and 71 carts, while renovating an additional 67 stores and 97 kiosks.”
| Jewelry Sales Trends - Zale vs Industry |
Zale’s Results from the Forte / Gove Team
Forte and Gove took the helm of Zale in mid-2002, after a couple of tumultuous years of executive turnover. In September 2000, Bob DiNicola, who had been running Zale, gave up his title of chairman to Beryl Raff, CEO. DiNicola subsequently came back as chairman of the board in February 2001, when Raff abruptly resigned after just five months as chairman. Further, Alan Shor, president and COO, resigned in July 2002. Sales have shown only very modest growth since that time, as the graph below illustrates.
Not surprisingly, flattish sales have led to flat profits, as the graph below illustrates. It is important to note that profit margins were flat before Mary Forte and Sue Gove took over the helm of Zale.
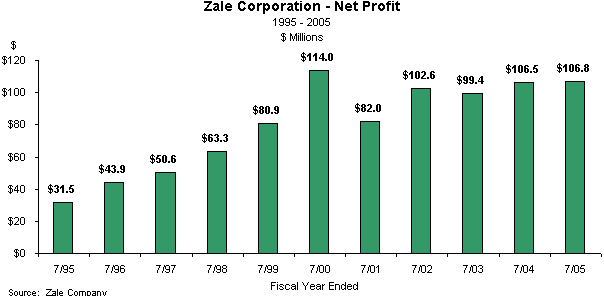
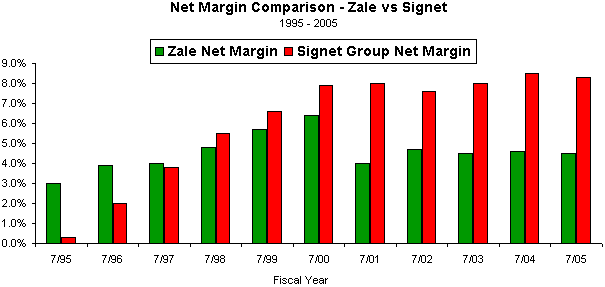
With sales and profits flat, Zale’s net profit margin is also about flat. However, it is notable that Sterling Jewelers, the second largest specialty jeweler in the U.S., suffers from the same margin flatness, though its net profit margin is almost double the level at Zale (see graph later in article).
Zale Is Fragmented
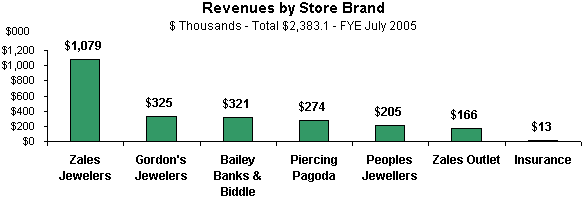
Zale Corporation is a fragmented company. It operates many brands, each with its own president and, apparently, with relative autonomy. Managing such a large array of brands is difficult for any corporation. The graph below illustrates sales contribution by each of Zale’s brands. Internet sales are included in each brand’s total revenues. In the most recent fiscal year, Zale’s online sales were about $18 million.
Source: Company Reports
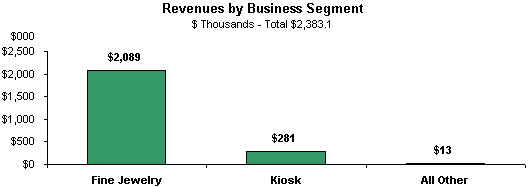
Recently, Zale began reporting financial results by another segmentation: fine jewelry, kiosks, and other. “Fine jewelry” consists of all of its store-based units; “kiosks” consists of Piercing Pagoda and the Peoples’ carts; “other” consists primarily of insurance revenues related to Zale’s private label credit card. The graph below summarizes revenues by business segmentation.
Source: Company Reports
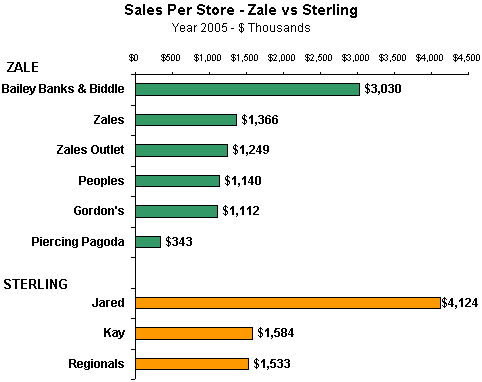
While rising total sales will help leverage operating costs, sales per store are also a very important factor in profitability. Stores have relatively high fixed costs. Thus, if sales per store are strong, profit leverage can be dramatic. Unfortunately, Zale’s per store sales lag its nearest competitor, Sterling Jewelers, as the following graph illustrates. These figures go a long way toward explaining Sterling’s higher net profit margin.
Source: Company Reports
While the different in sales per store between Sterling’s mass market units (Kay and regionals) is only about $300,000, the profit leverage is enormous, as the graph below illustrates.
Source: Zale & Signet Reports
What’s Next?
What is Zale going to do about these unfavorable trends? In its Annual Report to shareholders, as well as its legal filings and investor conference calls, management has been chanting a litany of strategies and programs to improve performance, including the following:
Company highlights for the fiscal year 2005 include:
- Achieved $2.4 billion in revenues, a record level.
- Expansion of internally-sourced product in Peoples Jewellers, and introduction to Gordon’s Jewelers and Zales the Diamond Store Outlet.
- Increased direct importing of finished merchandise from overseas vendors.
- Expansion of opening price point merchandise including charms, earrings, and body jewelry in Canada with 69 Peoples II cart locations.
- Focused real estate strategy on both traditional malls and off-mall growth in the U.S.
- Introduced database marketing capabilities and statistical modeling techniques to continue to improve marketing functions and enhance communications with customers.
- Implemented new human resources solution.
Key strategies for 2006 include the following:
- Enhancing the customer experience by implementing these programs:
- New point-of-sale solution
- Multi-channel initiatives
- Payroll services solution
- Increase market share
- Square footage growth of three percent
- Targeted and customer-focused marketing plan
- Implement supply chain strategy improvements
- Product sourcing across all brands
- Increase internally produced diamond products in existing store brands
- Design and test an integrated merchandise system
Is Zale serious about implementing direct-sourcing which essentially bypasses traditional jewelry wholesalers? Based on the company’s compensation reports, Zale’s “senior vice president, upstream supply chain” is the fifth highest paid person in the company. That represents a serious commitment by Zale management to reduce the cost of goods sold by taking vendors out of the traditional supply chain.
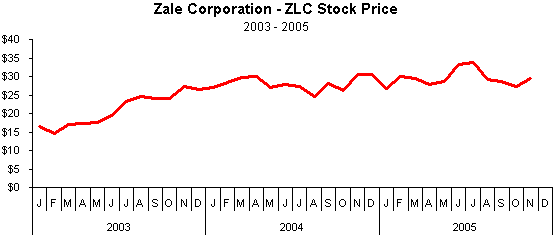
Will these strategies and programs work? Clearly, management has identified areas of weakness. Based on our twenty years of watching companies grow or struggle (sometimes both) on Wall Street, it seems that these strategies are sound. In fact, Wall Street has not penalized ZLC shares, given its disappointing performance. Between January 2003 and November 2005, ZLC shares have risen by 79 percent while the broad market S&P 500 Index is up 36 percent. Thus, Wall Street is a believer, as the following graph illustrates.
Source: New York Stock Exchange
The biggest problem, in our opinion, is translating these initiatives to the store level. In our store visits, Zale sales people still lack the drive, enthusiasm, and product knowledge that some other chain employees seem to have. Zale management has begun to address those issues, so we expect to see some improvement soon.
Taking the Long View
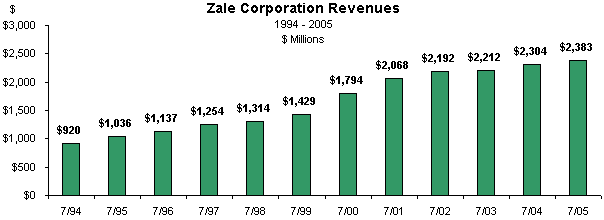
So, as we originally queried, is this short term pain for long term gain? After all, three years of relatively flat sales is a long time by some standards. To be fair, it is important to note that while Zale’s revenues have been weak, the company has continued to post a sales increase – though modest – every year since shortly after its 1992 bankruptcy, as the graph below illustrates.
Source: Zale Company
However, this string of sales gains could be in jeopardy, especially with the imminent closing of 30 BBB stores, which will remove a significant chunk of Zale’s revenues. Thus, it is likely that the company’s total sales could decline modestly for a couple of quarters or more, until revenues from new stores begins to fill the gap.
Remember, though, it is most important to take the long view. The company is clearly doing enough right to maintain positive – thought modest – momentum. It just needs a jump-start, and due to its size, it won’t come easily or quickly.
