IDEX Online Research: June U.S. Jewelry Sales a Little off the Mark, But Outlook Remains Bright
August 16, 07
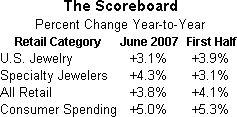
At the half-year mark, U.S. jewelry demand remains relatively robust, with jewelry sales gains at the higher end of our expectations. For the six months ended June 2007, total U.S. jewelry sales were up by 3.9 percent, near the top end of our initial forecast of +3-4 percent for the period.
While the sales gain of 3.9 percent for jewelry appears to be solid, it is slightly below the retail sales gain for all categories, except automobiles, of 4.1 percent. Further, the total sales gain for all jewelry is not broad based.
- Guild jewelers have been posting much stronger sales gains than mass market jewelers have. Jewelers like Tiffany & Co. and Birks & Mayors have been generating larger sales gains than Zale, Finlay and some other mass market jewelers. Even Sterling reported soft sales for the second quarter.
- Unfortunately, specialty jewelers’ sales lagged total jewelry industry sales gains. U.S. specialty jewelers posted a disappointing 3.1 percent increase in sales for the first half of the year. Essentially, this means that specialty jewelers lost market share to other merchants who sell jewelry, continuing a long term trend.
U.S. jewelry sales in June were up a disappointing 3.1 percent, but this was reflective of most retail categories which were weak during the month. Specialty jewelers, however, posted stronger gains in June, with sales up 4.3 percent for the month. Preliminary results for July indicate that consumer spending was stronger; thus, we expect U.S. jewelry sales to show a turnaround for July, when the numbers are released in mid-September.
Source: Various
While 50 percent of the year is gone, sales in the first six months represent just over 40 percent of a typical jeweler’s annual sales. Seasonally, retail jewelers’ sales are heavily biased toward the November-December period with roughly one-third of a jewelry merchant’s annual sales are generated. Thus, the second half of the year is the most important period for U.S. jewelers.
Our outlook for the second half of 2007 has brightened.
- We are now forecasting that U.S. jewelry sales will rise by 4.2 percent – with a range of +4.0 - 4.5 percent – for the full year. Earlier this year, we were projecting a gain in the 3-4 percent range; more recently, we raised our projection to +4 percent. Despite some underlying credit issues related to a small percentage of homeowners, the financial strength of most American families remains relatively strong, and is certainly unchanged from prior periods.
A final note: we have included the U.S. government’s revised jewelry sales tally for the past several years. Each year, sometime in the mid-summer period, most retail-related numbers that the government publishes undergo a “final” revision for the prior year. Further revisions are usually made only on an annual basis.
New data says that U.S. jewelry sales were $62.2 billion in 2006, a significant downward revision from the U.S. Department of Commerce’s prior estimate of $63.1 billion. Further, revisions were also made to prior years’ sales levels. The result is that we now believe jewelry sales were up by about 6.5 percent in 2006, rather than the earlier estimate of 7.1 percent. It is unusual for the Department of Commerce to make a revision of this large magnitude.
June Jewelry Sales Gains Weak
As expected, U.S. jewelry sales in June were weak, reflecting a general softness that affected virtually all retail categories. The weakest retail categories were generally big ticket durable goods such as furniture, building supplies and automobiles. Consumer demand for electronics and appliances was also weak.
Finally, sales of apparel and other department store goods were also soft. In short, jewelers were not immune to the general consumer malaise which affected demand for all retail goods.
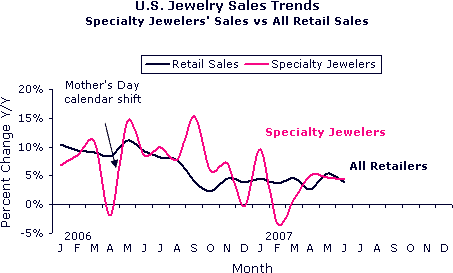
The graph below illustrates sales trends for both specialty jewelers and all retailers in the U.S. market since the beginning of 2006.
While both the black line on the graph (total retail sales ex-autos) and the red line (jewelry sales) have been sloping downward since early 2006, indicating an overall weakening of consumer demand, it appears that they may be approaching a bottom, based on a six-month trend line.
Source: US Dept of Commerce
Specialty Jewelers’ Sales Stronger
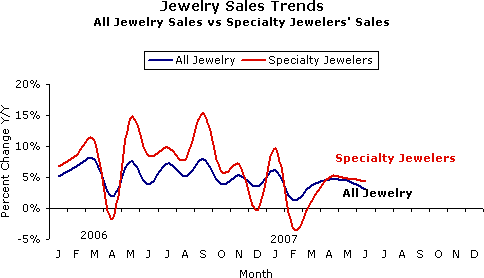
While specialty jewelers lost market share in the first half of 2007 to other merchants who sell jewelry, they picked up market share in the month of June. This comes as no real surprise. Jewelry which is purchased at other merchants often represents discretionary spending: consumers see something that catches their eye in Kohl’s, Wal-Mart, Sears or a similar merchant, and they buy it on impulse.
Purchases from specialty jewelers may be more planned, and appear to represent spending of funds that consumers have earmarked to a specific jewelry purchase. Further, most bridal jewelry, generally a non-seasonal and non-cyclical category, is purchased at a specialty jeweler. Thus, when discretionary spending is weak, specialty jewelers will often post superior results. But when consumers are flush with bonus money, tax refunds, and other one-time windfalls, their jewelry spending tends to increase at non-traditional jewelry retailers.
The graph below summarizes sales trends for specialty jewelers versus all jewelry since the beginning of 2006.
Source: US Dept of Commerce
Sales by Company Uneven
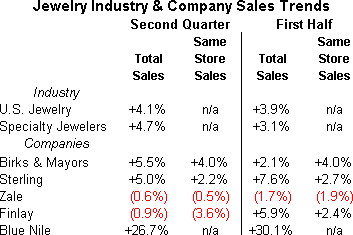
In general, guild jewelers posted stronger sales than mass market jewelers did during both the second quarter and for the full year. A few companies have reported sales for the second quarter and year-to-date period, as shown on the following table.
Source: Various
In a press release, Finlay Enterprises, which operates leased jewelry departments in major department stores in the U.S., noted that the earlier Mother’s Day selling period hurt its same-store sales by an estimated 3-4 percent in the second quarter. Thus, we could conclude that Finlay’s same-store sales in the second quarter were about flat on a “seasonally adjusted” basis, rather than the decline of 3.6 percent as reported. On a year-to-date basis (six months through July 2007), Finlay’s same-store sales were up 2.4 percent; this gain is reflective of the company’s true pace of business, in our opinion.
Signet Group said that its U.S. business – Sterling Jewelers – experienced a weak Mother’s Day selling period, but same-store sales have been up by about 3.8 percent in the quarterly period following Mother’s Day. Including the weak Mother’s Day, Sterling reported a 2.2 percent same-store sales gain in the quarter, as shown on the table above.
Zale’s performance was affected by two factors, according to management: 1) a change in accounting for its jewelry protection plan; and 2) a strategy to maximize gross profit dollars, even if it means sales are negatively affected. Zale remains a stressed company, and the revolving door continues to spin as top management comes and goes.
Birks & Mayors said that its sales increase of 5.5 percent (adjusted to reflect a 13-week period last year) was driven primarily by higher average retail prices of its merchandise. In addition, foreign currency translation related to its Canadian division also provided a boost to reported sales.
Blue Nile’s total sales rose by 26.7 percent in the second quarter; total orders were up by 27.2 percent. Its average ticket was $1,630, down 0.4 percent from the prior year. Sales of diamonds price above $25,000 were up 51 percent in the second quarter; the company made one sale of $1.5 million during the second fiscal period. If the impact of this single order is removed from Blue Nile’s average ticket calculation, its average sale in the second quarter would have been $1,594, or less than 3 percent below last year’s level. The modest decline in the average ticket is due to a change in sales mix toward lower ticket non-engagement merchandise.
Consumer Spending Cools in June
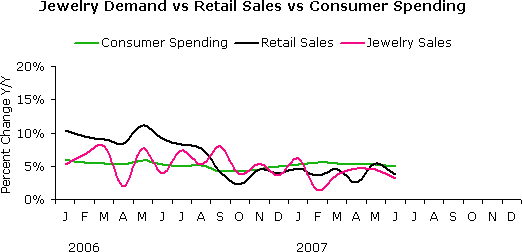
Consumer expenditures cooled somewhat in June; this trend had a flow-through effect on most retail categories. Many reasons have been offered as an explanation for this consumer spending slowdown, including a weaker job market, smaller wage gains, higher gasoline prices and a change in consumer sentiment.
We view the June weakness as the possible bottom of the spending trough. While home price appreciation is nearly non-existent and a credit crunch has affected a small percentage of all homeowners, Americans are born to spend. They may slow their shopping, but they are still in the stores. Thus, we think that it is not too likely that consumer spending trends will fall much lower than current levels.
The graph below summarizes consumer spending trends – all goods and services (green line) – as compared to total retail sales (black line) and jewelry sales (red line).
Source: US Dept of Commerce
Forecast: Solid Jewelry Demand in Second Half
The weak sales growth in June was probably an anomaly. However, burdens on consumers’ wallets remain heavy: gasoline prices remain relatively high and will constrain spending, especially among lower income households. Weakness in the housing market will take an increasing toll on consumer spending growth.
Stock market volatility adds uncertainty to consumer wealth levels. This potential pall of gloom is likely to affect consumers’ moods and their willingness to take on new debt. Further, there are some signs that job growth and income gains may be slowing. Finally, the savings rate remains negative and debt burdens are high; these trends must end, perhaps sooner rather than later.
Despite this seemingly negative near term outlook, we have raised our forecast for jewelry sales in the U.S. market for 2007 for the second consecutive month. Forecasters are suggesting that the U.S. economic slowdown will neither as long nor as deep as originally anticipated earlier this year. While economic growth in the first quarter was an anemic +0.7 percent, most forecasters are calling for overall economic growth for the year of 2 percent or more.
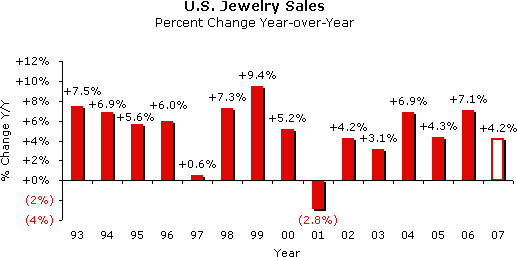
As a result of revised economic expectations, we have raised our forecast for jewelry sales in the U.S. market in 2007 to +4.2 percent from our prior prediction of +3.5 percent. We maintain a range of +4.0-4.5 percent for our forecast.
The graph below summarizes actual and estimated jewelry sales trends for the U.S. market by year.
Source: US Dept of Commerce, NIPA
Government Revises Consumer Spending Data
During the dog days of summer when most people are on holiday, government workers toil away making “final” revisions to prior years’ numbers. Sometime in July or August, these revisions are published, often without any fanfare. Data hounds, like us, have come to expect these revisions; others simply stumble over the revised data.
The U.S. Department of Commerce did not disappoint us this year; they recently published revised consumer expenditure data for all categories including jewelry. The big surprise, however, was the magnitude of the revisions. Normally, the numbers are revised by just a few basis points. This year, however, total jewelry sales were revised by more than one percent (one hundred basis points).
Because of these large revisions, the percentage change from year-to-year also changed notably. The only good news is that the “order of magnitude” of the percentage differences year-to-year did not change much. In other words, jewelry sales gains in 2006 were “above average,” and new data did not change that trend. On the other hand, the actual gain was smaller than earlier published numbers: +6.5 percent (2006 vs. 2005) rather than the originally published +7.1 percent.
The Department of Commerce revised not only 2006 data, but they also revised several prior years’ data.
Below are two graphs showing newly revised government data related to U.S. jewelry sales. We have also revised our jewelry sales forecast, based on the new data. The first graph shows actual retail sales of jewelry in billions of dollars. The second graph summarizes the percentage difference year-over-year.

Source: Jewelry Industry Research Institute
The solid black line on the graph below is a mathematically calculated trend line for jewelry sales gains. Clearly, the percentage gain, year-over-year, has been slowing for nearly three decades.
 Source: Jewelry Industry Research Institute |