IDEX Online Research: October U.S. Jewelry Sales Disappointing
December 18, 08
Total jewelry sales in October were 98.2 percent of last year’s levels, while specialty jewelers’ sales during the month were 95.2 percent of last year’s levels. That’s the optimist’s point of view. The pessimist would say that October jewelry sales fell by 1.8 percent and specialty jewelers’ sales plummeted by 4.8 percent in October.
Both would be correct, but the optimist has by far the best chance to survive in the current difficult retail climate. There’s an old adage in the retail industry: only optimists can be retail merchants.
We’re not trying to sugar-coat the statistics, but we do believe in looking at the glass as half full, not half empty.
October’s jewelry sales numbers were better than we had anticipated. We had expected that sales would have been about 93 percent of last year’s level – down 7 percent year-over-year. Even though October sales were above our anticipated levels, we aren’t adjusting our forecast for the year – sales for 2008 will likely be 99 percent-to-100 percent (flattish) of last year’s levels. Based on recently revised government statistics, that means U.S. jewelry sales will be about $65 billion for 2008.
The table below summarizes October jewelry sales as well as total retail sales (all categories) in the U.S. market. Sales data are measured as “dollars through the cash register” and are not “seasonally adjusted” nor have they been adjusted for inflation. We’ve shown the comparisons in conventional form – percent change from last year – rather than as a percentage of last year, an unconventional, but accurate presentation (by an optimist).
October 2008 – Monthly Sales Trends - percent Change from Prior Year
- (1.8%) - Total U.S. Jewelry Sales
- (4.8 %) - Total U.S. Specialty Jewelers’ Sales
- (3.9 %) - Total U.S. Retail Sales (All Categories)
- +0.9 % - Total U.S. Retail Sales (Ex-Auto & Food)
These numbers represent a weakening of both retail demand and jewelry demand that the U.S. market has experienced over the past several months. The table below summarizes key sales trends for the prior three months.

Source: Various
October Jewelry Sales Very Weak
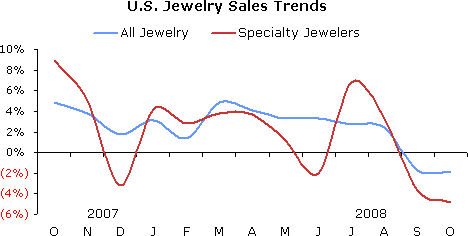
The total market for jewelry in the U.S. shrank marginally in October; sales were about 98 percent of last year’s level, or down just under 2 percent year-over-year. This is a continuation of a slowing sales trend which began in the first quarter of 2008 (see blue line on the graph below).
Specialty jewelers posted a notable sales decline of 4.8 percent for the month. This means they lost market share to other retailers who sell jewelry, but for whom jewelry is not their primary business (like Wal-Mart, Kohl’s, Sears and others). In recessionary periods, specialty jewelers tend to lose market share to discounters and others whose primary marketing message is “value.” Unfortunately, once specialty jewelers have lost market share, they never seem to regain it.
The jewelry industry gained a slight amount of market share when compared to all retail categories. Total retail sales (all goods, including food and automobiles) posted a decline – 3.9 percent – in October, dragged down by extremely weak auto sales.
The graph below compares specialty jewelers’ sales trends (red line) to total jewelry sales trends (blue line) in the U.S. market. As the graph clearly illustrates, jewelry sales at specialty jewelers have been on a roller coaster ride for the past year.
After sliding early last fall, jewelry sales posted a spike in October 2007, another slide in November and December, followed by a modest recovery in January, a small dip in February, and a modest recovery in March and April. In May, jewelry sales gains weakened substantially for specialty jewelers, with another major drop in June. Clearly, Mother’s Day (in May) was weak for specialty jewelers, but about normal for other retailers who sell jewelry. July sales for specialty jewelers rose significantly; we believe this is an aberration, and we continue to look for further revisions on the downside over the next few months.

Source: US Dept of Commerce
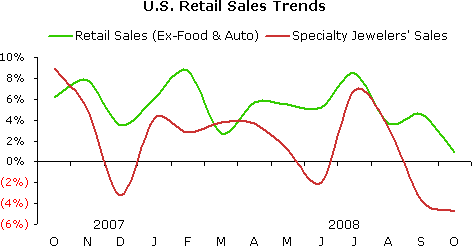
The graph below summarizes sales trends for all retail goods (green line) excluding food and automobiles versus specialty jewelers’ sales (red line). When food and auto sales are excluded, the remaining retail categories posted a very modest sales gain of 0.9 percent in October. When food and auto sales are included, retail sales were down 3.9 percent for the month, as previously indicated.
Why do we eliminate “automobile” sales? Monthly auto sales are driven largely by consumer incentives rather than by underlying economic factors. Over the long term, auto demand trends are an important indicator of consumer vitality; however, on a month-to-month basis, auto demand is dependent on manufacturers’ incentives such as zero percent financing, cash-back offers and other deals. Food sales are far less cyclical and can mask changes in consumer demand; thus, we eliminate them, too.

Source: US Dept of Commerce
Consumer Spending Continued to Slow in October
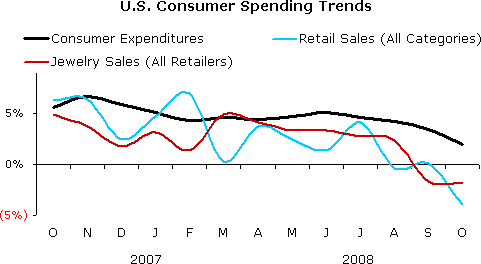
As inflation has slowed, growth of consumer expenditures has slowed from the first half of 2008. During October, consumer expenditures for all goods and services rose by 2.0 percent over the prior year. This represents a steady decline since June’s 5.1 percent gain, a point when the fires of inflation were most threatening.
What is behind the slowing of consumer expenditure growth? As the graph below shows, total retail sales growth took a dive in August and September, with a further decline in October. Spending on big-ticket durables – often financed on credit – suffered the most. Consumer expenditures on services remain more-or-less on track, with little monthly deviation.
The graph below summarizes trends in American’s total spending (black line), retail sales of all goods (blue line) and expenditures on jewelry (red line). It is clear that dismal automobile sales in the U.S. market are having a dramatic negative impact on total retail sales (blue line). Automobile sales in 2007 were just over 20 percent of total retail sales; thus, it is clear why they have such an impact on total retail sales trends. And, it should be obvious why we typically eliminate them, when we analyze U.S. retail sales. Automobile sales are driven largely by the “deal-of-the-day,” as we noted above.

Source: US Dept of Commerce
Jewelry Sales Forecast Unchanged
Last month, we revised our 2008 jewelry sales forecast for the U.S. market downward. Our forecast range remains unchanged – flattish to down about 1 percent for the full year (99 percent of last year’s levels). Strengthened headwinds and new data, especially in the consumer sector of the economy, have caused us to remain conservative during the current holiday sales period. A number of major jewelry chains are reporting double-digit declines in sales. However, these are generally mall-based chains, a distribution channel that is under extreme pressure due to declining customer traffic. Off-mall jewelers are generally reporting better results than mall stores. We’ve also seen a number of jewelers who decided that this was going to be a good holiday sales season, and they are making it happen. The winning strategy appears to be direct customer contact via the telephone.
It is important for jewelers to understand that our sales forecast is based on “dollars through the cash register” at the retail level. When jewelry price inflation is removed, jewelry sales in terms of units will likely be down about 7-8 percent for the full year.