IDEX Online Research: Jewelry Sales Deceleration Moderates in January
March 17, 09
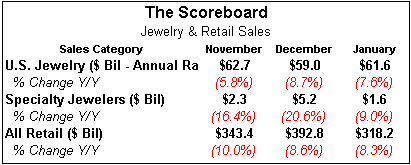
After dropping by just over 20 percent in December 2008, jewelry sales in U.S. specialty jewelers declined by about 9 percent in January 2009. Specialty jewelers’ sales in the U.S. were $1.615 billion in January 2009 compared to $1.774 billion in the prior year. While no one likes a negative comparison, January 2009 data was welcome, after two straight months of double-digit sales declines for jewelry merchants.
Total U.S. jewelry sales are running at an annual rate of $61.6 billion, based on January 2009 data, up from December’s $59.0 billion annual rate. This is a 7.6 percent decline from January 2008.
Total U.S. retail sales (all categories) were down 8.3 percent in January. This indicates that jewelers picked up market share from other retail categories.
The table below summarizes sales for the past three months for the U.S. market.
Source: Dept of Commerce
2008 Annual Jewelry Sales Adjusted Significantly
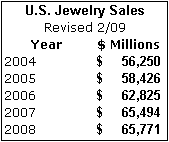
Based on newly adjusted government data, 2008 U.S. jewelry sales were $65.8 billion, up just 0.4 percent from the prior year. We note that the government statistics were heavily adjusted: almost $1 billion of sales were added to both 2007 and 2008 annual data during a revision published in February (2008 U.S. jewelry sales had been reported to be $64.9 billion earlier this year). This is an unusually large adjustment. However, these numbers will continue to be adjusted for several more months.
The table below summarizes revised annual jewelry sales for the U.S. market. Sales data for 2004 and prior years were not adjusted; 2005 and subsequent years’ data were revised significantly. U.S. jewelry sales represent just under half of global jewelry sales, which are estimated to be about $135-140 billion.
Source: Dept of Commerce
Based on the January 2009 total jewelry sales annual run rate of $61.6 billion, it appears that U.S. jewelry sales in 2009 will be down only 6.3 percent from 2008’s revised jewelry sales of $65.8 billion. This is close to the broad range of our forecast of a total sales decline for the U.S. jewelry industry of 7 percent-to-12 percent for 2009. Thus, it appears that 2009 is starting somewhat stronger than we had expected.
While we like our forecasts to be as accurate as possible, we are also pleased that the sales decline in January is not as great as we had predicted. However, we note that we still have eleven months left before the final results are tallied for 2009.
Revised U.S. specialty jewelers’ 2008 sales were $29.2 billion, down 4.9 percent from 2007’s sales of $30.7 billion. The government data did not adjust 2007 annual sales, but made a very minor adjustment downward (about $100 million) for the annual 2008 sales of specialty jewelers (preliminary data indicated that 2008 sales were $29.3 billion, down 4.7 percent). We expect very modest adjustments to these numbers over the next few months.
Specialty Jewelers Stage Strong Comeback in January
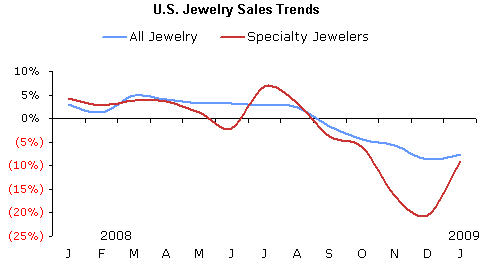
After extremely weak sales in November and December, specialty jewelers’ sales were down by only 9.0 percent in January. This was slightly worse than the total jewelry industry sales decline of 7.6 percent and it indicates that specialty jewelers lost very little market share in January.
IDEX Online Research maintains a database of sales results for a number of specialty jewelers, and their sales correlate closely to the numbers which were released by the government for the month of January. In short, it seems reasonably safe to say that jewelry sales for specialty jewelers were down in the single digit range during January 2009. Specialty jewelers are defined as any entity whose primary business is jewelry sales. Chains as large as Kay and Zale are included, along with single store operators across America.
As the graph below illustrates, January jewelry sales showed a hopeful upward turn.
Source: Dept of Commerce
Jewelers Took Market Share from Other Retailers
During January, total jewelry sales in the U.S. were down 7.6 percent, while total retail sales (including food and automobiles) were down 8.3 percent. This indicates that jewelers picked up a very modest “share of wallet” from consumers. We believe this may be due to heavy liquidation sales which some jewelers conducted in January. It confirms that there is still solid demand from consumers for jewelry, and, at the right price, they will open their wallets and buy gemstones, precious metals, and watches.
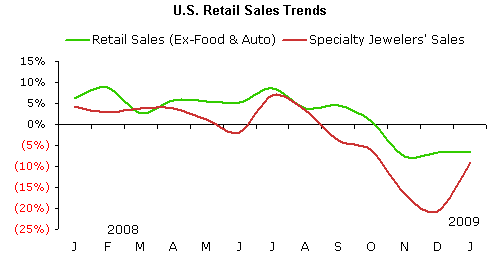
The graph below summarizes sales trends for all retail goods (green line) excluding food and automobiles versus specialty jewelers’ sales (red line). When food and auto sales are excluded, the remaining retail categories posted a sales decline of 6.6 percent in January. Thus, jewelers lost a small amount of market share to this category of retail goods. When food and auto sales are included, retail sales were down 8.3 percent for the month, as previously indicated, and jewelers picked up modest market share. On average, though, it is reasonable to say that jewelers more or less held their own in January. Because jewelry is a discretionary expenditure, we are impressed with these results.
Why do we eliminate “automobile” sales? Monthly auto sales are driven largely by consumer incentives rather than by underlying economic factors. Over the long term, auto demand trends are an important indicator of consumer vitality; however, on a month-to-month basis, auto demand is dependent on manufacturers’ incentives such as zero percent financing, cash-back offers and other deals. Food sales are far less cyclical and can mask changes in consumer demand; thus, we eliminate them, too.
Source: Dept of Commerce
Consumer Spending Showed a Very Modest Recovery in January
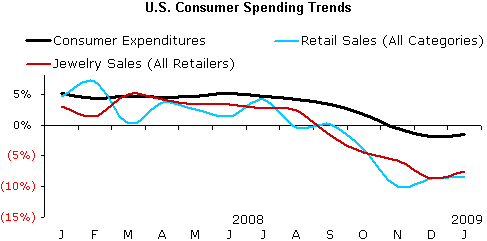
As inflation has dissipated over the past few months, growth of consumer expenditures has also slowed from the early months of 2008. In December, consumer spending was 1.9 percent below the prior year. However, in January, preliminary figures show that consumer spending dipped by only about 1.6 percent from January 2008. This is another hopeful sign, but it is too early in the year to read anything into it, in our opinion.
What is behind the slowing of consumer expenditure growth? As the graph below shows, total retail sales growth has taken a dive since the early Fall. Spending on big-ticket durables – often financed on credit – has suffered the most. Consumer expenditures on services also slowed modestly.
The graph below summarizes trends in American’s total spending (black line), retail sales of all goods (blue line) and expenditures on jewelry (red line). It is clear that dismal automobile sales in the U.S. market are having a dramatic negative impact on total retail sales (blue line). Automobile sales in 2007 were just over 20 percent of total retail sales; thus, it is clear why they have such an impact on total retail sales trends. And, it should be obvious why we typically eliminate them, when we analyze U.S. retail sales. Automobile sales are driven largely by the “deal-of-the-day,” as we noted above.
Source: Dept of Commerce
Our Forecast: Very Tentative, But Fearless As Ever
We’re an optimist at heart, though we try to be realistic. While talk continues about the possibility of a depression, we think that it won’t happen – at least in the U.S. – because the problem has been attacked early and head-on.
Our preliminary forecast calls for U.S. jewelry sales in 2009 to be between about $58 billion and $61 billion, a decline of about 7 to 12 percent from 2008.
In the Great Depression, jewelry sales fell by about 70 percent from peak to valley over a multi-year period, and it took about eight years for jewelry sales to recover to pre-Depression levels. We don’t believe that this scenario will repeat itself.