IDEX Online Research: 2008 U.S. Jewelry Sales Revised Sharply Downward
August 13, 09
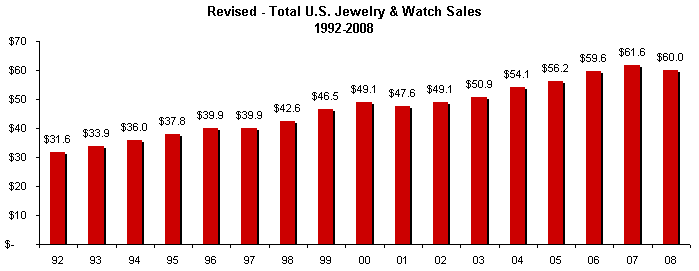
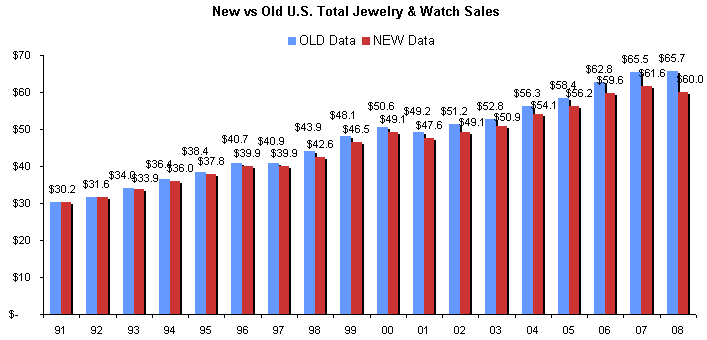
Total jewelry sales in the U.S. market during 2008 have now been pegged at $60 billion, a sharp downward revision from the previously reported $65.7 billion, according to new data from the Department of Commerce’s Bureau of Economic Analysis (BEA).
This revision for jewelry industry sales was part of a broad-based massive revision of virtually all sales numbers for every category of consumer expenditures, including retail goods, services, and other outlays. In addition, data for all components of GDP – consumer, business, government and import/export – were revised.
Here are the key revisions relating to the U.S. jewelry industry:
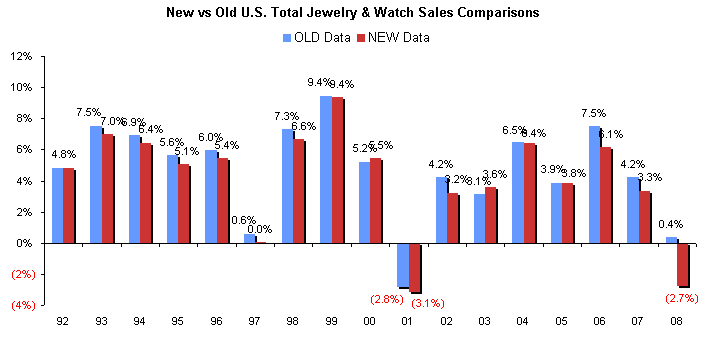
- U.S. jewelry sales of $60 billion in 2008 were down 2.7 percent from the prior year’s revised. Prior data indicated that jewelry sales were up 0.4 percent for the year, a number that did not seem possible in the recessionary environment.
- Specialty jewelers’ sales were about 47 percent of total jewelry industry sales, up from the previously reported 43 percent. We have contended that specialty jewelers generate about half of all U.S. jewelry sales; the new data confirms this.
- The BEA will now begin reporting separate sales numbers for watches, which were previously included in with jewelry sales. BEA data indicates that watch sales are just over 11 percent of total jewelry industry sales; this number correlates very closely to the 12 percent sales mix reported by the Consumer Expenditure Survey as well as the LGI Network sales data for “fine” watch sales.
The BEA has published revised annual data and selected monthly sales back to 1959, with additional data back to 1929 to be published later this month.
Revision Expected
Every five years, the BEA revises its databases. This year, the revisions were especially comprehensive: virtually all of the numbers the BEA publishes were revised. For example, Gross Domestic Product data were revised, the savings rate was revised (it did not turn negative in 2005, as previously reported), import and export data was revised, government spending numbers were changed, business expenditures were revised, and consumer spending information was redefined and revised.
IDEX Online Research has cast doubt on the total industry sales numbers released by the BEA since the 2006 numbers were published. Unfortunately, there is no solid method for cross-checking the BEA numbers, other than by comparing sales of specialty jewelers. The BEA numbers include jewelry sales by all merchants who sell jewelry, including discounters, mass merchants, and specialty retailers, as well as specialty jewelers.
We were contacted earlier this year by the BEA; they asked for our assessment of the data, and we were candid. It was clear that the government representative also felt that the jewelry sales numbers had grown too rapidly.
In addition to jewelry sales data, virtually every one of the several hundred consumer expenditure categories was revised; some categories were deleted and some new categories were added.
IDEX Online Research will work diligently over the next several weeks to update its hundreds of databases, tables and graphs with the new data. As those databases are updated, we will publish relevant revised information.
In addition to revisions to its jewelry sales data, the Census Bureau, also a division of the Department of Commerce, has reported new data about the number of jewelry establishments in the U.S. These numbers appear to confirm that the number of jewelry stores may be fewer – by 5 percent or so – than previously reported. A full analysis of this data will be published in the near future.
New Sales Data
While the Bureau of Economic Analysis said it revised selected data back as far as 1929, it revised total jewelry industry sales data back only to 1993. However, the BEA did break out watch sales versus jewelry sales back to 1959, and we expect that the agency will provide this break-out back to 1929, when those figures are reported.
The good news is that even though the dollar sales figures changed, there were no major deviations in sales trends. The BEA simply trimmed jewelry industry growth each year by a few basis points. In years when jewelry sales declined, the loss was larger than previously reported by a few basis points. However, because of the cumulative change of a few basis points each year, the aggregate sales decline by 2008 was magnified to a drop of nearly ten percent versus sales data reported earlier this year.
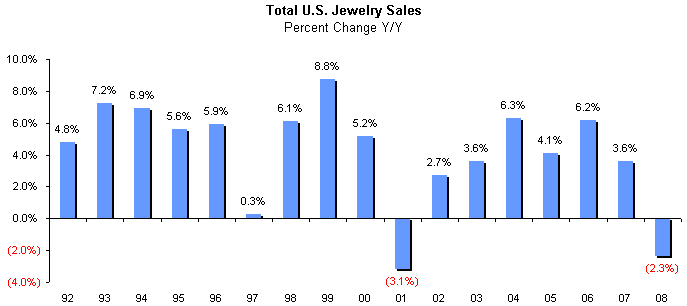
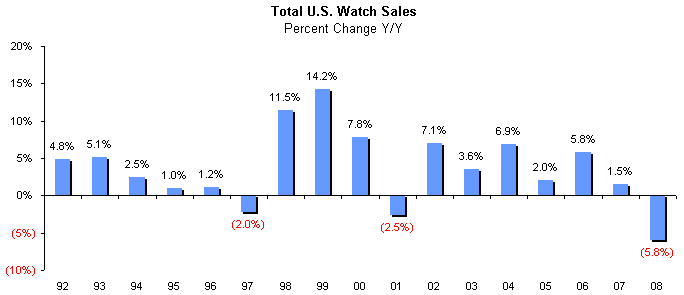
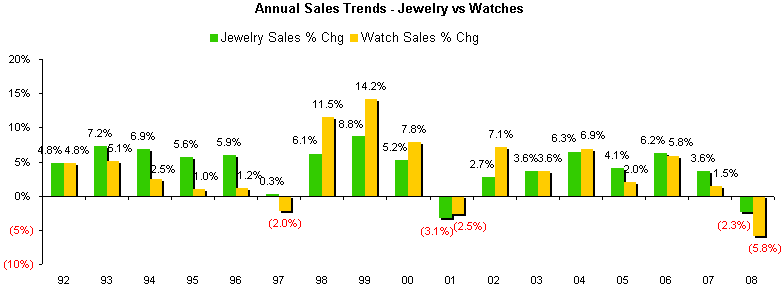
Perhaps the most important sales trend related to 2008 jewelry sales versus 2007’s numbers. Previously, the BEA had reported that 2008 jewelry sales were up 0.4 percent (flat, for all practical purposes). We had repeatedly noted that this did not seem correct, based on our industry cross-checks. The BEA sales data now shows that total jewelry and watch sales in the U.S. market dropped by 2.7 percent in 2008 versus the prior year. Jewelry sales declined by 2.3 percent while watch sales declined by 5.8 percent, according to revised data.
By comparison, the LGI Network reported that fine watch sales (watches priced at $50 retail and higher) were down 8 percent in 2008. The BEA numbers support the credibility of the LGI data; higher-priced watch sales declined by a greater level than popular-priced watches (those priced below $50 retail).
Further, specialty jewelers’ sales in 2008 were down 6.1 percent, versus the newly revised BEA data for the total industry showing a 2.7 percent sales decline. We are now more comfortable with the BEA data; we know that specialty jewelers’ sales were harder hit than jewelry sales at multi-line merchants.
In short, the revised BEA jewelry industry sales data appears to be much more credible than in the recent past.
The following graph summarizes U.S. jewelry sales beginning in 1992 (data was unchanged for that year). Data in subsequent years was revised by the BEA.
Source: BEA Dept of Commerce
The following graph compares previously published data with the newly revised data from the BEA. The sales data from 1991 and 1992 are unchanged; subsequent years reflect revised data.
Source: BEA Dept of Commerce
With only a couple of exceptions, prior jewelry industry sales growth was trimmed very modestly each year since 1992. The graph summarizes the percentage change in annual jewelry sales based on “old” data versus the newly revised data from the BEA. It is clear that the BEA made a substantial change in its 2007 and 2008 sales data. However, it also cut sales growth significantly in 2006 and 2007, as the graph illustrates.
Source: BEA Dept of Commerce
Jewelry Sales Break-Out Data
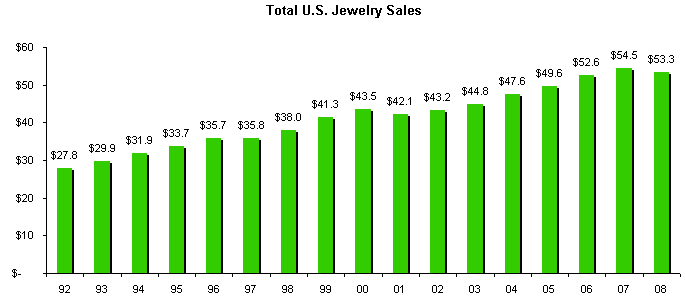
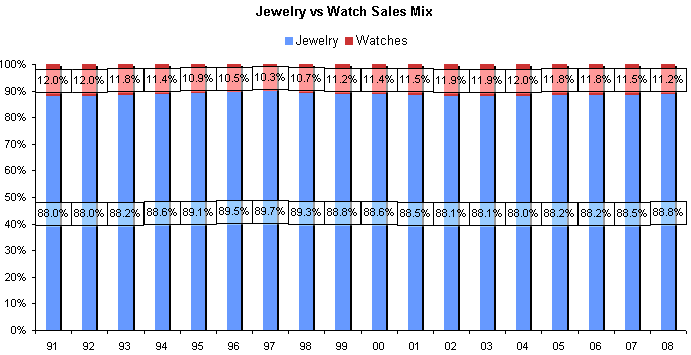
The Bureau of Economic Analysis is now providing a break-out of jewelry versus watch sales for the U.S. market. According to BEA data, watch sales are just over 11 percent of total industry sales, while jewelry sales account for roughly 89 percent of industry sales. The Consumer Expenditure Survey pegs watch sales at about 12 percent of total jewelry industry sales. Thus, this cross-check adds credibility to the watch sales numbers.
The following graph summarizes jewelry (only) sales since 1992.
Source: BEA Dept of Commerce
The following graph summarizes the annual percentage change in jewelry (only) sales for the U.S. market since 1992.
Source: BEA Dept of Commerce
Watch Sales Data
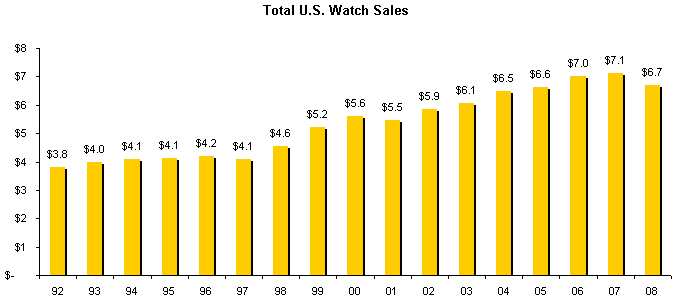
For the first time, the BEA is now reporting watch sales separate from jewelry sales. The BEA does not discriminate by price points for watches: if it is a time piece, the sales are counted.
The following graph summarizes watch sales (only) by year from 1992.
Source: BEA Dept of Commerce
The following graph summarizes the annual percentage change in watch sales (only) since 1992.
Source: BEA Dept of Commerce
Jewelry vs. Watch Sales
The following graph summarizes the change in the sales mix between jewelry and watches since 1992. For all practical purposes, there is very little change in the sales mix on an annual basis, based on the BEA sales data.
Source: BEA Dept of Commerce
The following graph compares the annual percentage change in sales of jewelry versus the annual percentage change in sales of watches. Generally, when the economy weakens, watch sales decline far and fast. Conversely, when the economy is strong, watch sales soar. Our research among specialty jewelers confirms this trend.
Source: BEA Dept of Commerce
Specialty Jewelers Generate About Half of All Jewelry Sales
Historically, specialty jewelers have generated about half of all jewelry sales in the U.S. market. However, in 2008, specialty jewelers’ sales mix fell sharply to about 43 percent of all sales, based on “old” BEA data. We had some difficulty reconciling that number in our research. Now, new data from the BEA confirms that specialty jewelers generate nearly half of all U.S. jewelry sales. Granted, specialty jewelers have been losing market share, but not nearly as rapidly as prior data had indicated.
The graph below summarizes specialty jewelers’ total sales as a percentage of U.S. jewelry sales.

Source: BEA Dept of Commerce
Global Jewelry Sales
The total figure for global jewelry sales is elusive: we see a wide variety of numbers in print, generally in the $125-140 billion range. Based on the new U.S. jewelry sales data, we now believe that global jewelry sales were in the $130-135 billion range during 2008.
Additional Research Reports Planned
IDEX Online Research will begin assimilating the newly revised BEA data. Apparently, the BEA also revised economic growth numbers – GDP. Like jewelry, the overall trends were basically unchanged; however, the annual percentage change shifted by a few basis points. There were other changes in the BEA databases, too.
As IDEX Online Research completes its analysis of the new data, additional research will be published, and graphs and tables will be updated. We anticipate publishing a new sales forecast for the U.S. market, based on the new BEA data as well as consensus forecasts relating to economic growth and the end of the next economic cycle (around 2014, according to some economists).