IDEX Online Research: Consumer Demand for Jewelry Shows Hopeful Signs
August 20, 09
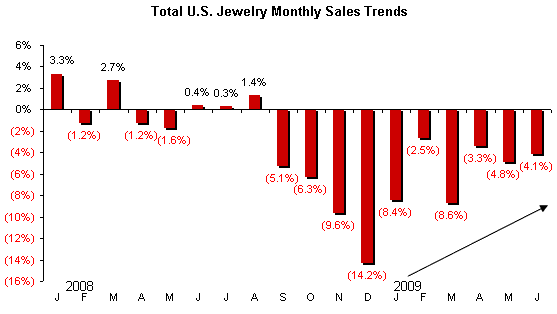
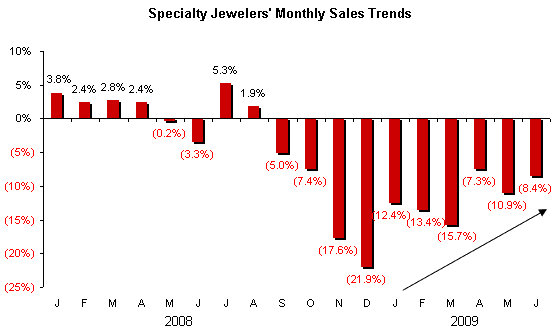
America’s jewelers report that monthly jewelry sales comparisons, while still negative so far this year, are showing signs of perking up. After a disastrous 2008 holiday selling season when total jewelry sales dropped by a mid-teen number, and specialty jewelers saw their sales dip by more than twenty percent, monthly sales comparisons in 2009 have continued to improve – that is, they are less negative, and the trend is toward positive comparisons, likely by October or November 2009. Further, the year-to-date rate of decline in jewelry sales has dropped each month since early this year.
The following is a summary of June jewelry and watch sales (June 2009 versus June 2008):
All Jewelry & Watch Sales (4.1%) (All retail merchants who sell jewelry)
Jewelry (4.1%)
Watches (4.3%)
Specialty Jewelers’ Sales (8.4%) (Specialty jewelers only)
Trends Point to Positive Momentum
The data above provides only a snapshot of June jewelry sales. It is more important to understand the longer term trends. The graph below summarizes total jewelry sales made by all categories of retail merchants – specialty jewelers, discounters, mass merchants, online retailers, and any merchant who sells any jewelry. The sales decline was worst at the end of 2008, and trends have been encouraging since then, as the graph illustrates. This graph represents newly revised data from the Department of Commerce.
Source: US Dept of Commerce
The graph below summarizes specialty jewelers’ sales trends since the beginning of 2008. The sales valley was reached in December 2008, and since then, jewelry sales trends have shown that the rate of decline is moderating.
Source: US Dept of Commerce
2009 Sales Forecast Revised . . . Again
Two months ago, we raised our jewelry sales forecast for the U.S. market for the full year of 2009: we predicted that jewelry sales could be up very modestly this year.
However, the Department of Commerce’s Bureau of Economic Analysis recently released a massive revision of consumer expenditures by retail category. Not only were 2008’s U.S. jewelry sales cut from $65.8 billion to $60.0 billion, but historic monthly sales trends were revised downward, resulting in more pessimistic trends. Pre-revision sales comparisons suggested that 2008 jewelry sales were up 0.4 percent over 2007; post-revision comparisons showed that jewelry sales in 2008 were down 2.7 percent. We use historic data compared to a variety of economic factors to drive our jewelry sales forecast.
We now believe that U.S. jewelry sales in 2009 could be down 2-4 percent, based on our forecast model’s analysis of the new data. This would result in 2009 jewelry sales of $57.5 billion to $58.5 billion, down modestly from 2008’s $60.0 billion.
We build our jewelry sales forecast model on a month-by-month basis. Our assumptions call for negative sales comparisons through the end of the third quarter, with positive comparisons in October, November and December. Because jewelry sales are heavily weighted to the fourth quarter, these three months of positive comparisons have a dramatic impact on overall annual sales levels.
Economic Background: Fear Reigned Briefly, Before Reality Returned
The U.S. economy, which is showing early signs of improvement, was never in nearly as much danger as some of the media had reported. Casual comparisons to the Great Depression were far off-base, and were irresponsible, in our opinion, even during the period of the greatest uncertainty – late 2008 and early 2009. At that point, fear set in, fanned by the flames of uninformed media. Since then, reality has begun to return, and the economy is headed back to normalcy.
For an explanation of why this recession bears virtually no resemblance to the Great Depression, go to Wikipedia and search for “late 2000s recession.” About halfway through the article, there is a section comparing the Great Depression to the current recession.
A few economists insist that the current recession is over. The Fed clearly believes that the worst is behind us: their recent actions suggest that there is enough positive momentum in the U.S. economy that the Fed does not need to adjust interest rates or the money supply.
Many specialty jewelers said the past year and a half felt terrible, but it appears that monthly peak-to-valley specialty jewelers’ sales declined by just over 20 percent at the worst of the current recession, far less than the 70 percent declined in the Great Depression. In other words, sales ran at an annual rate of 80 percent or so of the prior year at the end of 2008. That is the worst time of year for weak sales, but real disaster could be defined as “no sales” or even “50 percent of sales.” Is anyone reporting those kinds of truly disastrous sales comparisons? Just ask your friendly yacht dealer. Check with jet fuel purveyors which supply owners of private jets. Sales declines of 70 percent or more appear to be commonplace in those industries.
There have been a couple of surprises that have affected jewelry demand in the current recession: the sharp decline in demand at the high end and the above-average weakness of demand for diamonds and diamond jewelry. Our explanation: high-income and very wealthy consumers likely made their money in the stock market and real estate. In the current recession, these two asset classes were brutally hurt. Even if those consumers didn’t lose everything, they felt – and continue to feel – less wealthy. When consumers feel less wealthy, they tighten their purse strings.
June Specialty Jewelers’ Sales Far Less Weak than Earlier This Year
Specialty jewelers posted sales of just over $1.9 billion in June 2009 versus $2.1 billion in the same month a year ago, a decline of 8.4 percent. This helped reduce the year-to-date sales decline for specialty jewelers to about 11.4 percent.
Total U.S. jewelry sales – at all merchants, including specialty jewelers as well as discounters, mass market merchants, and others – posted an annual sales run-rate of just under $59.2 billion in June, well above the average run rate in the first quarter of about $58.2 billion (all results are based on revised BEA data). These figures compare to 2008’s total jewelry sales of $60.0 billion, and they are showing improvement from prior months’ comparisons.
In June, the Department of Commerce did not make any notable revisions to its database (it left this to its sibling, the BEA), though on-going revisions may result in numbers which do not agree exactly with data published previously by IDEX Online Research. Readers are cautioned to use only the latest data shown throughout this report. We are seeing revisions in government numbers more frequently and at a greater magnitude than at any time in the past couple of decades. Apparently, the volatile economic conditions have challenged the government’s current research sampling techniques, yielding “preliminary” numbers that are subject to greater revision.
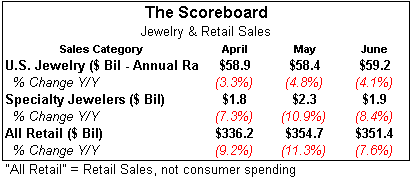
The table below summarizes retail sales and consumer spending trends for total jewelry, specialty jewelers, and all retailers for the past three months ended June 2009.
Source: US Dept of Commerce
Specialty Jewelers Continue To Lose Market Share in June
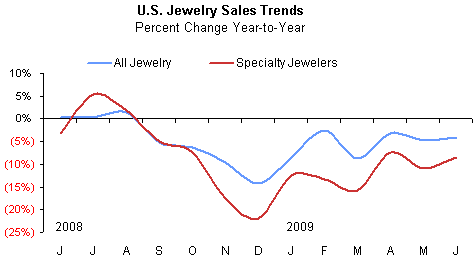
Ever since the fall of 2008, specialty jewelers have been losing market share to other retail merchants who sell jewelry. Historically, specialty jewelers tend to lose market share in recessionary periods, and they never regain that lost market share.
As the table above illustrates, prior months’ comparisons showed that specialty jewelers lost significant market share in April, May and June. In 1972, specialty jewelers had 73 percent of the market; by 2008, their market share had slipped to about 48 percent, based on revised government figures.
The graph below contrasts specialty jewelers’ sales trends (red line) with total jewelry sales trends (blue line) for the past year.
Source: US Dept of Commerce
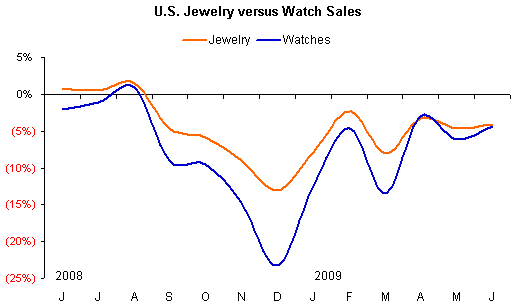
Watch Demand Weaker Than Jewelry Demand
During June, weak demand for watches in the U.S. market pushed watch sales down by 4.3 percent from June 2008. Demand for jewelry was less depressed in June, posting a loss of only 4.1 percent from the same month a year ago. Early in the recession, watch sales began to fall faster than jewelry sales for several reasons: 1) consumers shopped down for watches – they went to their neighborhood discounter, rather than their friendly jeweler; 2) watch collectors, who are generally wealthier than average, felt the impact of the recession earlier than other demographic segments, so they cut back on their collections (we’ve seen an increase in fine watches offered for sale on e-Bay); and, 3) watches appear to be more of a discretionary purchase than jewelry, so consumers cut their watch purchases first, before making deeper cuts in their discretionary spending which then began to affect jewelry.
As a result of the Department of Commerce’s revision of consumer expenditures, the government now segments jewelry and watch sales with only a 30-day delay; historically, these categories were combined and available only on an annual basis, with a two-year delay. The graph below summarizes jewelry and watch expenditures by month over the past year.
Source: US Dept of Commerce
Jewelry Demand Holds Its Own Against Other Retail Categories in June
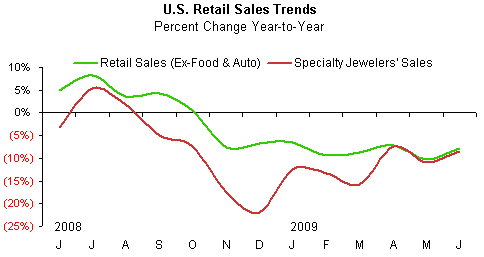
In June 2009, total jewelry sales were down only 4.1 percent, while total retail sales, ex-auto and food, were down 7.9 percent. Thus, jewelry picked up market share from other retail categories.
Specialty jewelers roughly kept their market share versus other retail categories in June; they posted a sales decline of 8.4 percent, barely below the total retail sales (ex-auto and food) decline of 7.9 percent. We eliminate auto and food categories because they can distort overall consumer demand trends. Auto sales are driven by the “deal of the day” promotion, while food demand is not discretionary. If auto and food categories are included, U.S. retail sales were down 7.6 percent in June, slightly “less bad” than the decline in specialty jewelers’ sales.
However, the good news is shown on the graph below: both jewelry sales and retail sales showed upward trends from prior months during June. Further, the graph illustrates that the rate of sales decline appears to have more or less leveled out.
The graph below summarizes sales trends for all retail goods (green line) excluding food and automobiles versus specialty jewelers’ sales (red line).
Source: US Dept of Commerce
Consumer Spending Levels Out In June
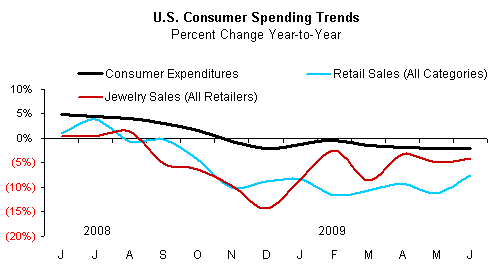
Total consumer expenditures declined by 2.1 percent in June, the weakest month so far this year. However, the decline was almost the same as May’s dip – 2.0 percent. The on-going weakness in consumer spending is due to two key factors: 1) weaker consumer demand due to recessionary pressures; and, 2) lack of price inflation. In January, consumer spending was 1.2 percent below the prior year. However, in February, consumer spending dipped by only 0.5 percent from the same month in 2008. In March, revised data shows that total consumer spending was down 1.5 percent – said another way, it has been running at roughly 98-99 percent of last year’s levels. Unfortunately, in April, the downdraft in consumer spending continued: down 1.8 percent (revised), followed by May with a 2.0 percent decline, revised from a drop of 2.8 percent.
The graph below summarizes trends in American’s total spending (black line), retail sales of all goods (blue line) and expenditures on jewelry (red line). It is clear that dismal automobile sales in the U.S. market are having a dramatic negative impact on total retail sales (blue line). Automobile sales in 2007 (a “normalized” year) were just over 20 percent of total retail sales; thus, it is clear why they have such an impact on total retail sales trends. And, it should be obvious why we typically eliminate them, when we analyze U.S. retail sales: automobile sales are driven largely by the “deal-of-the-day,” as we noted above.
Source: US Dept of Commerce
Revised Forecast: U.S. Jewelry Sales Likely Down Modestly In 2009
Newly released jewelry sales data from the Department of Commerce suggests that the former data was too optimistic. As a result, we have revised our previous jewelry sales forecast for the U.S. market downward.
Earlier, we had expected that jewelry sales might be flattish in 2009 versus 2008, based on strengthening in demand during the all-important fourth calendar quarter.
However, the Department of Commerce’s Bureau of Economic Analysis recently released a massive revision of consumer expenditures by retail category. U.S. jewelry sales in 2008 were reduced from $65.8 billion to $60.0 billion, and historic monthly sales trends were revised downward, resulting in more pessimistic trends. Pre-revision sales comparisons suggested that 2008 jewelry sales were up 0.4 percent over 2007; post-revision comparisons showed that jewelry sales in 2008 were down 2.7 percent.
When the Department of Commerce’s new data is entered into our forecast model, it suggests that jewelry sales in the U.S. may be down 2-4 percent in 2009. This would result in 2009 jewelry sales of $57.5 billion to $58.5 billion, down modestly from 2008’s $60.0 billion.
We build our jewelry sales forecast model on a month-by-month basis. Our assumptions call for negative sales comparisons through the end of the third quarter, with positive comparisons in October, November and December. Because jewelry sales are heavily weighted to the fourth quarter, these three months of positive comparisons have a dramatic impact on overall annual sales levels. We are assuming that there will be no major “system shocks.”
Specialty Jewelers’ Sales Likely To Be Down Mid-Single Digit Levels in 2009
For specialty jewelers, the 2009 sales decline could be 4-7 percent from 2008, yielding annual sales of nearly $27 billion. In 2008, specialty jewelers’ sales were $28.3 billion, down 6 percent from 2007’s $30.1 billion. Earlier this year, we had been predicting that specialty jewelers’ sales would be near $26 billion. However, with improving trends, it now appears that our original forecast was too bearish.
We’ve had several requests for our forecast for the all-important fourth calendar quarter. In our opinion, jewelry sales will be up from last year, if for no other reason than comparisons are so very easy. For specialty jewelers, sales in November were down nearly 18 percent, and December 2008 sales were down roughly 22 percent. We believe that specialty jewelers’ sales in November and December 2009 could be up by a low-to-mid single digit level. This suggests that 2009 holiday sales would be in the $7.5-$8.0 billion range, notably above last year’s $7.2 billion, but still below 2007’s $9.1 billion. The good news is this: late this year, we should start reporting sales comparisons using black ink, instead of the dreaded red ink that indicates a sales decline.
If our forecast of nearly $27 billion for specialty jewelers in 2009 proves reasonably correct, and if 2009 is, in fact, the bottom, specialty jewelers will have experienced an annual sales decline of only about 22 percent or so from peak-to-valley – on a monthly basis – in the current recession. The year-over-year peak-to-valley decline would be much less – perhaps no more than 10 percent. This is a far cry from the 70 percent peak-to-valley annual decline experienced in the Great Depression.