IDEX Online Research: Jewelry Demand Wanes in July
September 22, 09
The summer doldrums have set in at retail in the U.S. market. Jewelry sales for July were below expectations, as were sales in other retail categories. Apparently, consumers were lounging around the pool, trying to cool off from the season’s heat and humidity, rather than shopping at their favorite merchant.
The following is a summary of July jewelry and watch sales (July 2009 versus July 2008):
All Jewelry & Watch Sales (8.3%) (All retail merchants who sell jewelry)
Jewelry (7.9%)
Watches (11.4%)
Specialty Jewelers’ Sales (13.5%) (Specialty jewelers only)
Unfortunately, these trends are more negative than in the prior three months, when demand appeared more solidifying. However, the overall trend for jewelry demand in 2009 is still positive. Year-to-date sales are stable, and the prospects for a reasonably good – certainly better than last year – holiday selling season are on the horizon.
Trends Still Suggest Positive Momentum
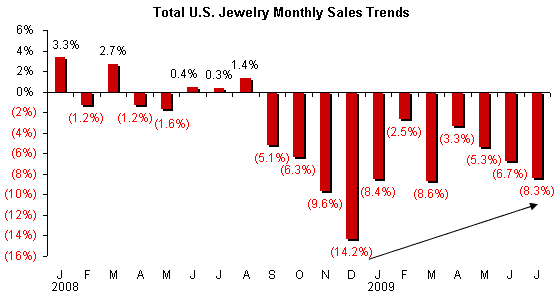
The data above provides only a snapshot of July jewelry sales. It is more important to understand the longer term trends. The graph below summarizes total jewelry sales made by all categories of retail merchants – specialty jewelers, discounters, mass merchants, online retailers, and any merchant who sells any jewelry. The sales decline was worst at the end of 2008, and trends have been generally encouraging since then, as the graph illustrates, though July sales were weaker than expected. This graph represents newly revised data from the Department of Commerce.
Source: US Dept. of Commerce
Specialty jewelers’ sales have fared worse than the overall industry as consumers have sought bargains – “value-priced jewelry” – at discounters and mass market merchants who are perceived to offer lower prices than specialty jewelers. Based on our original forecasts, specialty jewelers’ July sales of just under $1.9 billion were about $100 million short of our expectations. Assuming roughly $60 billion of annual jewelry sales, a $100 million shortfall – less than a 0.2 percent variance – doesn’t seem like much. But, it is a large number – about 5 percent – for July.
Lower End of Jewelry Sales Forecast Likely
Our jewelry sales forecasts have been bouncing around this year. Each month brings in new data and new trends, all of which must be considered when making a sales forecast. This year, there was a special challenge: the Bureau of Economic Analysis made a substantial revision in jewelry sales data for the past decade and a half. Essentially, it reduced its estimate of jewelry sales by almost 9 percent for 2008, and made similar revisions to prior years.
Previously, we had been predicting that total jewelry sales would be down by 2-4 percent in 2009 versus last year. We are now thinking that jewelry sales will be down by nearly 4 percent, based on the latest data and industry trends. This would result in industry sales of $57.5 billion to $57.8 billion versus almost $60.0 billion last year.
We have also revised our forecast for specialty jewelers: sales are likely to be in the range of $26.0-26.5 billion versus last year’s $28.3 billion, a decline near 7 percent. Our sense is that this forecast could still be a bit optimistic, but we do not look for a double-digit decline. In 2008, specialty jewelers’ sales were down 6.1 percent, though December sales were down by almost 22 percent.
The only good news is that we expect November and December sales for specialty jewelers to be up from last year’s dismal levels. If so, it will yield a positive percentage comparison, and that alone would be psychologically uplifting.
Recession Over?
At the end of June, a couple of brave economists insisted that the U.S. recession was over. Since then, those fearless forecasters have been joined by a chorus of other economists, including the chairman of the Federal Reserve, who say that it is highly likely that the recession is over. Here’s the problem with this: it still feels like a recession to most jewelers. Unfortunately, jewelry is often one of the industries which softens first in a recessionary environment, and it tends to recover last. Thus, it is no surprise that jewelers are not feeling solid demand trends, yet.
In our opinion, jewelers will begin posting positive sales comparisons in November – or perhaps even October. At that point, the industry should begin to see that the recession of 2008-2009 – being dubbed The Great Recession – will be receding into the history books.
Assuming that these forecasters are correct, the peak-to-valley decline in specialty jewelers’ sales during the current recession will be about 14 percent. For total jewelry, the peak-to-valley sales decline will be about 7-8 percent. In the Great Depression of 1929, jewelry sales dropped by about 70 percent peak-to-valley.
By 2011, jewelry sales in the U.S. market should be back to 2007 levels, or perhaps slightly higher. Thus, it will take about three years for a complete recovery.
July Specialty Jewelers’ Sales Reflect Weakness
Specialty jewelers posted sales of just under $1.9 billion in July 2009 versus $2.1 billion in the same month a year ago, a decline of 13.5 percent. This held the seven-month year-to-date sales decline for specialty jewelers to about 11.6 percent, broadly unchanged from the six-month year-to-date change.
Total U.S. jewelry sales – at all merchants, including specialty jewelers as well as discounters, mass market merchants, and others – posted an annual sales run-rate of $56.9 billion in July, somewhat below the average run rate in the first quarter of about $57.7 billion, and notably below the annual run rate of $58.2 billion in the second quarter (all results are based on revised BEA data). These figures compare to 2008’s total jewelry sales of $60 billion.
In July, the Department of Commerce made minor revisions to its database of specialty jewelers’ sales; these on-going revisions may result in numbers which do not match with data published previously by IDEX Online Research. Further, the BEA made some more significant revisions in July to monthly jewelry industry sales numbers earlier this year; in each case, the data was more bearish. Readers are cautioned to use only the latest data shown throughout this report. We are seeing revisions in government numbers more frequently and at a greater magnitude than at any time in the past couple of decades. Apparently, the volatile economic conditions have challenged the government’s current research sampling techniques, yielding “preliminary” numbers that are subject to greater revision.
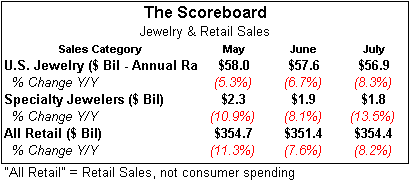
The table below summarizes retail sales and consumer spending trends for total jewelry, specialty jewelers, and all retailers for the past three months ended July 2009.
Source: US Dept. of Commerce
More Market Share Losses in July for Specialty Jewelers
Ever since the fall of 2008, specialty jewelers have been losing market share to other retail merchants who sell jewelry. Historically, specialty jewelers tend to lose market share in recessionary periods, and they never regain that lost market share.
As the table above illustrates, prior months’ comparisons showed that specialty jewelers lost significant market share in May, June, and July. In 1972, specialty jewelers had 73 percent of the market; by 2008, their market share had slipped to about 48 percent, based on revised government figures.
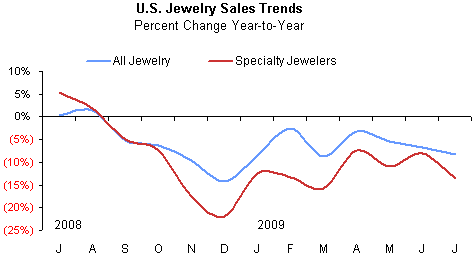
The graph below contrasts specialty jewelers’ sales trends (red line) with total jewelry sales trends (blue line) for the past year.
Source: US Dept. of Commerce
Watch Demand Much Weaker Than Jewelry Demand
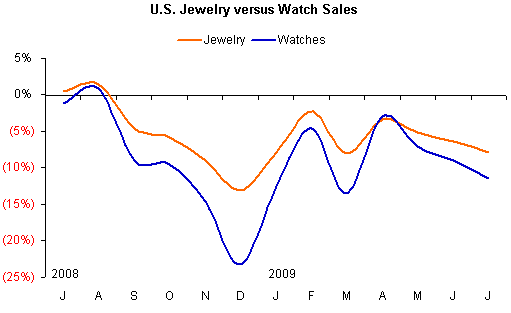
During July, weak demand for watches in the U.S. market pushed watch sales down by 11.4 percent from July 2008. Demand for jewelry was less depressed in June, posting a loss of 7.9 percent from the same month a year ago.
Early in the recession, watch sales began to fall faster than jewelry sales for several reasons: 1) consumers shopped down for watches – they went to their neighborhood discounter, rather than their friendly jeweler; 2) watch collectors, who are generally wealthier than average, felt the impact of the recession earlier than other demographic segments, so they cut back on their collections (we’ve seen an increase in fine watches offered for sale on eBay); and, 3) watches appear to be more of a discretionary purchase than jewelry, so consumers cut their watch purchases first, before making deeper cuts in their discretionary spending which then began to affect jewelry.
The graph below summarizes jewelry and watch expenditures separately by month over the past year.
Source: US Dept. of Commerce
Jewelry Demand Weakness Similar to Other Retail Categories in July
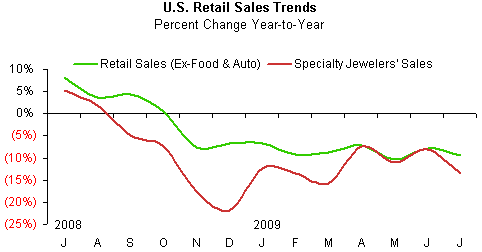
In July 2009, total U.S. jewelry sales were down 8.3 percent, while total retail sales, ex-auto and food, were down 9.5 percent. Thus, jewelry picked up some market share from other retail categories. However, total retail sales (including automobiles and food) were down about 8.2 percent.
Specialty jewelers lost market share versus other retail categories in July; they posted a sales decline of 13.5 percent, notably below the total retail sales (ex-auto and food) decline of 9.5 percent. We eliminate auto and food categories because they can distort overall consumer demand trends. Auto sales are driven by the “deal of the day” promotion, while food demand is not discretionary.
The graph below summarizes sales trends for all retail goods (green line) excluding food and automobiles versus specialty jewelers’ sales (red line). It is clear that total retail demand weakened in July; jewelers participated to a greater degree in the decline than many other retail merchants.
 Source: US Dept. of Commerce |
Consumer Spending Shows Slight Uptick in July
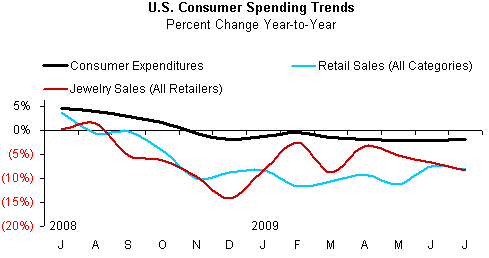
Total consumer expenditures declined by 1.8 percent in July, the second consecutive month that trends show smaller declines. This is one of the hopeful signs which signal that the recession may be abating – or over.
The graph below summarizes trends in American’s total spending (black line), retail sales of all goods (blue line) and expenditures on jewelry (red line). It is clear that dismal automobile sales in the U.S. market are having a dramatic negative impact on total retail sales (blue line). Automobile sales in 2007 (a “normalized” year) were just over 20 percent of total retail sales; thus, it is clear why they have such an impact on total retail sales trends. And, it should be obvious why we typically eliminate them, when we analyze U.S. retail sales: automobile sales are driven largely by the “deal-of-the-day,” as we noted above.
Source: US Dept. of Commerce
Revised Forecast: U.S. Jewelry Sales Likely Down Modestly In 2009
Based on July jewelry sales trends as well as recently revised monthly sales data from both the Department of Commerce and the Bureau of Economic Analysis, our forecast model suggests that jewelry sales in the U.S. may be down close to 4 percent in 2009. This would result in 2009 jewelry sales of $57.5 billion to $57.8 billion, down modestly from 2008’s $60.0 billion.
We build our jewelry sales forecast model on a month-by-month basis. Our assumptions call for negative sales comparisons through the end of the third quarter and perhaps into October, with positive comparisons in November, and December. Because jewelry sales are heavily weighted to the fourth quarter, these three months of positive comparisons have a dramatic impact on overall annual sales levels. We are assuming that there will be no major “system shocks.”
For specialty jewelers, the 2009 sales decline could be near 7 percent from 2008, yielding annual sales of nearly $26.0 billion to $26.5 billion. In 2008, specialty jewelers’ sales were $28.3 billion, down 6 percent from 2007’s $30.1 billion.
We’ve had several requests for our forecast for the all-important fourth calendar quarter. In our opinion, jewelry sales will be up from last year, if for no other reason than comparisons are so very easy. For specialty jewelers, sales in November 2008 were down nearly 18 percent, and December 2008 sales were down roughly 22 percent. We believe that specialty jewelers’ sales in November and December 2009 could be up by a low-to-mid single digit level. This suggests that 2009 holiday sales would be in the $7.5-$8.0 billion range, notably above last year’s $7.2 billion, but still below 2007’s $9.1 billion. The good news is this: late this year, we should start reporting sales comparisons using black ink, instead of the dreaded red ink that indicates a sales decline.
If our forecast of roughly $26.0-26.5 billion for specialty jewelers in 2009 proves reasonably correct, and if 2009 is, in fact, the bottom, specialty jewelers will have experienced an annual sales decline of only about 22 percent or so from peak-to-valley – on a monthly basis – in the current recession. The year-over-year peak-to-valley decline would be much less – perhaps no more than 14 percent.