The 2009 Diamond Pipeline: The Year to Forget
May 11, 10
|
|
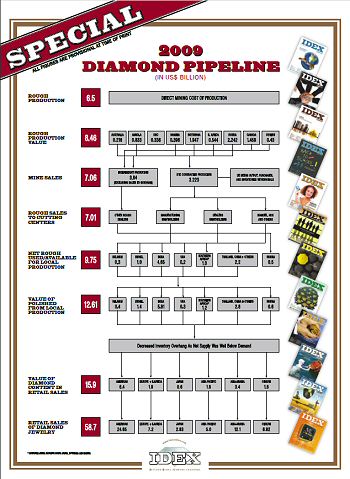
The amount of “distress” sales was minimal, at least in terms of “what could have been.” The industry understood that the contraction was the logical result of the (reverse) ripple effect, the process of severe de-stocking at all levels of the pipeline. This culminated in about a 50 percent reduction in rough supplies into the pipeline.
Anticipating this fall in demand, producers reduced mining operations. However, producers did not act in tandem. Russia’s Alrosa maintained full production to preserve jobs but sold at least some $1.4 billion to its government (Gokhran). The miner also accumulated a higher stock of diamonds.
Consumer Demand Declined Modestly
On the downstream side of the pipeline, worldwide diamond jewelry consumer demand fell by slightly less than 10 percent. The decline was not distributed equally. The most severely hit was the U.S. with a 16 percent reduction, followed by Europe and Japan with a 10 percent fall. In the Asian and Middle Eastern markets, the decline was less profound, at around 2 percent.
The pipeline measures the diamond content (at polished wholesale prices or PWP) in the final retail levels. Thus, while the U.S. may account for half of global diamond jewelry consumption, its share of diamond content fell below 43 percent. The Middle East, India and Asia now account for 38 percent of diamond consumption – and this figure is growing. Japan has fallen to less than 5 percent. Europe hovers in the 14 percent area.
Global Mining Output Down 40 Percent
The value of the worldwide mining output fell from $14.3 billion in 2008 to $8.4 billion in 2009. In terms of carats, worldwide production went down from 165 million carats in 2008 to 124 million carats in 2009, which includes all categories (including industrial qualities).
The “pain” was not shared equally throughout the pipeline. Botswana’s production was slashed from 32.3 million carats in 2008 down to 17.7 million carats in 2009. De Beers’ mines in South Africa saw an even steeper reduction from 11.96 million carats in 2008 to 4.97 million carats in 2009. The Namibian output fell from 2.1 million carats in 2008 to 929,000 carats in 2009.
A year of such demand volatility also impacted valuations of production. In our pipeline, we have valued Botswana’s 2009 output at $110 per carat. It is clear that for some part of the year, the Diamond Trading Company (DTC) sold at lower prices, absorbing the loss at the DTC level rather than at the Botswana levels. While we value Botswana’s output at $1.95 billion, we think that the actual DTC sales price materialized in the $1.67 billion range.
 |
The DRC is, unfortunately, a mess. The official production may have trickled down to $200 million. Official exports from the DRC are grossly undervalued, and smuggling is rife. We estimate the DRC’s 2009 output at $336 million – one of the lowest it has seen in many years.
What the global crisis certainly has underscored is that informal productions have been hit more severely than the carefully “orchestrated” and “fine-tuned” cutbacks in the organized sector. There are few surprises.
The enormous potential of Zimbabwe will probably earn it a separate rubric next year; for now, we have assumed a 2.3 million carat output at $80 million. In fact, it may be more – much more – but we might not be able to substantiate such a figure. This will have to wait for next year’s pipeline.
The Cutting Centers Destocked Heavily
The diamond content in retail sales, measured in polished wholesale prices, went down from $18.4 billion in 2008 to $15.9 billion in 2009. The interesting level is that of local manufacturing in the cutting centers. In 2008, it overproduced polished at $19.7 billion, causing a downstream oversupply as the diamond content in retail sales was lower. In 2009, mostly pipeline stocks were sold, which resulted in new polished production of some $12.6 billion; this figure was well below the sales of $15.9 billion.
The $3 billion stock withdrawal does not only represent what we call the “overhang” but also shows stocks becoming available because of the decision to replenish at a lower level. This is part of the ripple effect. The pressure exerted by banks to sell off stocks may have been too strong. At the end of 2009, we did not see excess stocks in the cutting centers –on the contrary, there was probably a $.05 billion shortage at year’s end, causing such a buoyant rough demand in early 2010.
Looking Forward
The year 2009 was unusual, and we expect the 2010 pipeline to look quite different. The most exciting news is that at the end of 2009, the retail level reached the stabilization phase as the downward slide came to a halt. The retail level will move sideways in 2010. Because of the ripple effect, this means that in all upstream levels of the pipeline we expect a healthier demand to materialize.
In 2010, we will see that polished demand from the cutting centers will go up by some 30 percent to reach $17 billion. The producers’ sales to industry will jump from its $7.1 billion level to at least $12 billion.
The 2009 pipeline will go down in history as an aberration, or what we hope will turn out to be a “one-time fluke.” It always remains amazing how the speed in which we go down in a crisis is matched by the intensity of its recovery. Having said this, because of the long-term supply fundamentals, and the reduced rough availability, we are not likely to go back to 2007 levels yet. However, in our minds, 2009 will fade quickly into oblivion.
