IDEX Online Research: Jewelry Inflation High For Producers, Low For Retailers (Full Analysis)
July 01, 10
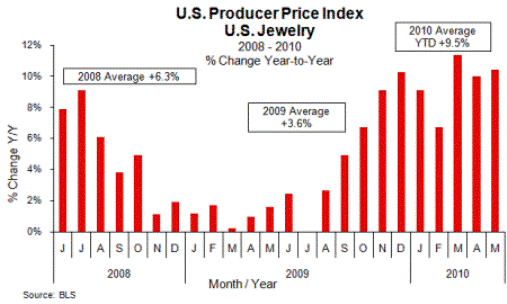
Producer prices for jewelry rose sharply in May by 10.4 percent, when compared to May 2009, driven primarily by higher prices of precious metal jewelry – mostly gold. The Jewelry Producer Price Index has been in the high single-digit range or low double-digit range for all of 2010 as well as the fourth quarter of 2009. Producer prices have risen at double-digit levels for the past three months.
The graph below summarizes the Jewelry Producer Price Index – jewelry price inflation at the supplier level – for the past 24 months.
|
|
While the Jewelry Producer Price Index averaged a very modest +3.6 percent inflation rate in 2009 during a recessionary environment when demand was soft, it has averaged 9.5 percent for the first five months of 2010 in a “recovery” environment.
JPPI Driven By Higher Precious Metals Costs
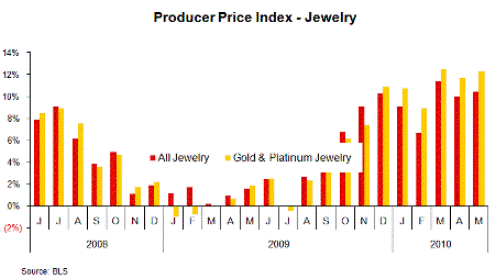
Precious metals costs jumped in March, hit a short-term plateau in April and began to climb again in May. As of mid-June, gold prices were in the $1,250 per ounce range, the high for the current cycle, and appeared to be headed higher. The graph below compares the JPPI for all jewelry producer prices (red bars) to the JPPI for precious metal jewelry costs (yellow bars).
|
|
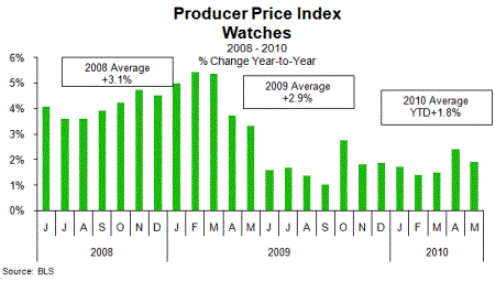
Producer price inflation for watches had languished just above 1 percent or so for the first three months of 2010, but rose to over 2 percent in April, but pulled back to 1.9 percent in May, as the following graph illustrates.
| |
Jewelry Consumer Price Inflation Remains Modest
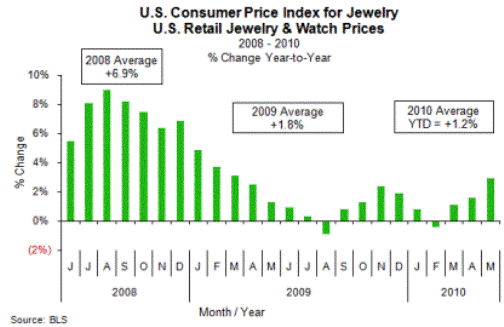
Retail prices of jewelry in May, as measured by the JCPI, rose by their highest level so far in 2010 – +2.9 percent – but retail price inflation for jewelry remains very modest, especially when compared to the JPPI. For the first five months of 2010, the JCPI is up by 1.2 percent. This year-to-date inflation rate for retail jewelry prices remains well below 2009’s average retail jewelry inflation rate of +1.8 percent; it also remains far below 2008’s inflation rate of 6.9 percent.
The graph below summarizes the JCPI for the past 24 months.
|
|
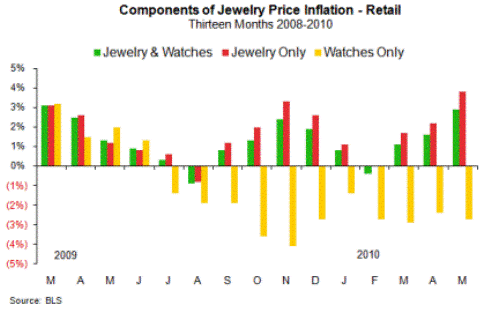
The key components of the JCPI – jewelry (only) and watches (only) – reveal great disparity between inflation for these two key segments. Watch prices continue to decline at retail, while jewelry prices are rising slightly faster than the overall JCPI. Watch sales are about 11 percent of total jewelry industry sales, while jewelry of all types represents about 89 percent of total U.S. jewelry sales.
The graph below illustrates inflation among the key components of the JCPI. The green bars are total industry JCPI, while the red bars represent the inflation rate jewelry (only), and the gold bars represent the inflation rate for watches (only).
| |
The Chasm Between Producer and Consumer Jewelry Price Inflation
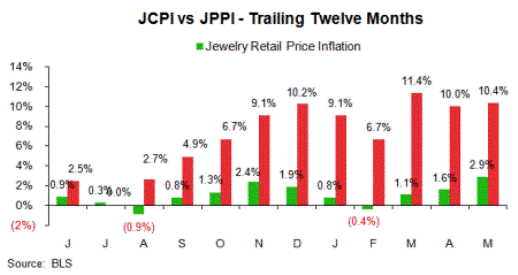
There is a huge spread between inflation at the jewelry producer level and the jewelry retail store level, as the graph below illustrates.
|
|
In our opinion, this graph illustrates why there will need to be some event that will bring balance to the market. Either wholesale prices will be rolled back – unlikely, in our opinion – or retail prices will show sharp increases later this year – the most likely scenario.
With evidence that shoppers are back in the stores, and with jewelry sales levels that have returned to near pre-recession levels, it is likely that retail jewelers will be able to implement price increases that will not crimp demand just as the party is heating up. However, there is a fine line between the level of price increases that are acceptable to consumers versus what will turn off the spending spigot.
