IDEX Online Research: Birks & Mayors on Road to Recovery
August 02, 10
Birks & Mayors’ sales in the second quarter of 2010 showed a solid rebound, after the prior year’s weak performance. Following is a breakdown of what happened.
· Birks & Mayors’ (BMJ) sales in April-June of 2010 were up by 11.8 percent to $59.9 million (USD), with same-store sales up 6 percent. Same-store sales in Canada were ahead by 9 percent, while U.S. same-store sales rose by a more modest 2 percent.
· BMJ’s sales for the full fiscal year ended March 2010 were down 5.8 percent to $255.1 million. Corporate same-store sales were down 6 percent, with a 1 percent same-store sales decline in Canada and a 12 percent same-store sales drop in its stores in the U.S. market.
· Sales for the second half of BMJ’s fiscal year (October 2009-March 2010) were up 11.3 percent to $152.8 million. This compares to the company’s sales decline of 23.5 percent for the first half of its fiscal year (April-September 2009).
The company reported what appeared to be a smaller loss in its fiscal year versus the prior year, but a close analysis shows that its operating loss for the most recent fiscal year widened.
· In its press release, it said that the company had a net loss of $19.5 million versus a loss in the prior year of $61 million; both years included unusual charges. If the unusual, one-time charges are eliminated, the company lost about $18.1 million from operations in the most recent fiscal year versus a loss of $14.6 million in the prior fiscal year.
· As a Canadian corporation, the company is not required to file quarterly financial data. Thus, it did not report anything other than sales for its first quarter. However, we believe that its normal seasonal loss was likely smaller in the March-May 2010 period versus the same three months last year.
Birks & Mayors’ Sales Trends Follow Industry Trends
Birks & Mayors’ sales trends generally follow jewelry industry sales trends in both the U.S. and Canada. At year-end the company had 35 stores in Canada (33 Birks and two Brinkhaus units), and it operated 29 stores in the U.S. (Mayors Jewelers). During the fiscal year ended March 2010, it closed six stores (four in Canada and two in the U.S.) and opened one new unit (in the U.S.), for a net decline of five stores.
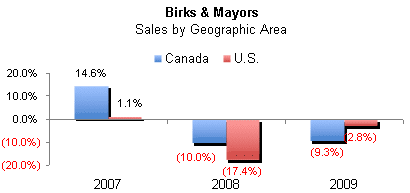
For the fiscal year, the company’s U.S. stores generated sales of $135.4 million, down about 3 percent from the prior year, while its Canadian stores generated $119.7 million, down about 9 percent year-over-year. All figures are U.S. dollars.
Sales trends for the past three years for Birks & Mayors by geographic territory were as follows:

Source: StatCanada
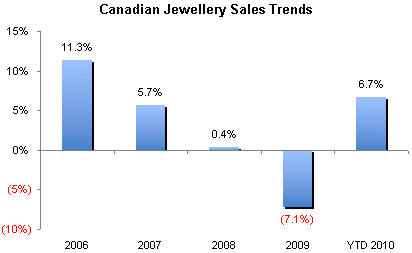
By comparison, Birks & Mayors’ sales trends track more or less to overall Canadian jewelry sales trends, as the graph below illustrates.

Source: StatCanada
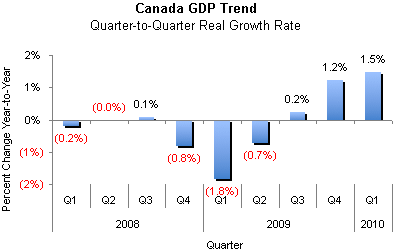
After bottoming in the first quarter of 2009, the Canadian economy has begun to show a recovery, as the graph below illustrates. Birks & Mayors’ sales trends lag a recovery in GDP; this is typical for jewelers.

Source: StatCanada
Other Financial Highlights FYE March 2010
While Birks & Mayors reported that total sales for the fiscal year ended March 2010 were down by only 5.8 percent, they declined by 7.8 percent when currency translation is removed.
Birks & Mayors’ gross margin slipped to 41.0 percent of sales from the prior year’s 42.7 percent due to increased discounting and sales mix shifts, all brought about by retail pricing pressure from competitors.
The company’s operating cost ratio improved: it fell to 41.7 percent of sales versus 42.1 percent of sales in the prior year. Most of the decline was due to lower compensation due to lower sales and fewer employees. At the end of the year, the company had 873 employees, down from 935 at the end of the prior year and down from 1,046 at the end of its fiscal year March 2008. Further, net marketing costs (after allowances for co-op advertising rebates) were 3.7 percent of sales versus 3.9 percent of sales in the prior year.
Same-store inventory levels fell by 13 percent during the year, according to management. Total inventories per store were down only about 0.3 percent, after adjusting for store closings.
The company has its Rhode Island manufacturing facility – now idle – on the market. It moved the production and machinery to its Montreal facility. Essentially, the real estate, a 19,200 square foot building, is for sale.
First Fiscal Quarter Highlights
For its first fiscal quarter ended June 2010, Birks & Mayors total sales were up 11.8 percent to $59.9 million versus $53.6 million in the prior year. When currency swings are removed, sales were up a more modest 4.3 percent. This is a continuation of trends set in the second half of the most recent fiscal year for the period October 2009 through March 2010.
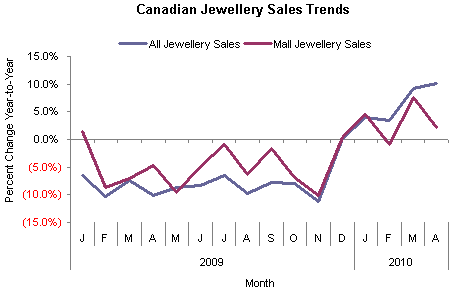
As in the past, Birks & Mayors sales trends correlate with jewelry sales trends in the Canadian market, as the graph below illustrates. Management noted, however, that sales in its Canadian markets were stronger than in its U.S. markets. Corporate same-store sales were up 6 percent in the first quarter, with Canadian same-store sales up by 9 percent and U.S. same-store sales up by 2 percent.
The graph below summarizes total Canadian jewelry sales, both in all stores and only mall stores. Clearly, Birks & Mayors’ sales track broadly with these country-wide trends.

Source: StatCanada