IDEX Online Research: US Specialty Jewelers Losing Share of Wallet
July 12, 15
American shoppers have stepped up their spending on jewelry over the past 10 years, but specialty jewelers have lost both market share and consumers’ share of wallet. Instead, shoppers are spending their jewelry dollars at multi-line merchants like Wal-Mart, J.C. Penney, Costco and others, according to new data from the Bureau of Labor Statistics (BLS).
Specialty jewelers – those chains and independent merchants whose primary business is selling fine jewelry and watches – are a diminishing segment of the overall US jewelry retail industry. According to the BLS data, their contribution to the American economy has waned over the past decade as they have fallen out of favor with American shoppers. In contrast, the economic contribution and market share from jewelry sales at multi-line retailers has continued to increase over the 10-year period 2004-2014.
The total number of specialty jewelry retail employees, along with the total number of specialty jewelry stores, has fallen significantly since 2004, according to the BLS. Total wages paid by specialty jewelers to their employees has remained roughly stagnant over the past 10 years, and industry pay scales are low, making it difficult to attract qualified employees who can sell high-ticket luxury goods.
There is some good news for specialty jewelers, despite these disappointing industry statistics: jewelers’ sales per store and sales per employee have risen notably, while the number of employees per store has fallen. This means that specialty jewelers’ store operations have become more efficient, and profits should be stronger.
Here are the key findings from the new BLS data for the US jewelry industry:
· The specialty jewelry industry has lost nearly 35,000 employees since 2004. In 2014, there were 121,732 employees working in specialty jewelers’ stores, down from 156,475 10 years earlier, a decline of 22 percent over the 10-year period. The only good news is that jewelry industry retail employment has picked up from a recession low of 118,000 employees. The graph below illustrates employment trends in the US jewelry industry from 2004 through 2014.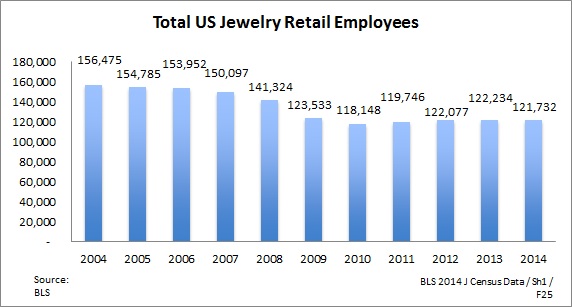
· Total specialty jewelry doors have fallen by 19 percent annually over the past decade. In 2004, the BLS says there were 26,642 jewelry stores; in 2014, there were only 21,599 stores. This data is less onerous than data from the Jewelers Board of Trade (JBT), which shows that there were 28,772 specialty jewelers in 2004, a number that declined to 21,463 in 2014, a decline of about 25 percent. The JBT census measures “active” retail jewelers, so there is always a small, mostly non-material difference between JBT data and BLS data. The graph below summarizes the decline in the number of specialty jewelry stores serving the growing US Thus, fewer specialty jewelry merchants are serving a greater number of households – about 126 million households in 2014 versus about 116 million in 2004, an increase of almost 9 percent or 10 million households.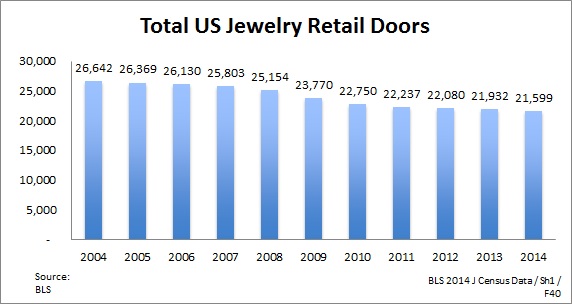
· Total wages paid by specialty jewelers are barely up over a 10-year period. In 2004, the US specialty jewelry industry contributed employee wages of $4.3 billion annually; in 2014, the annual economic wage contribution to the US economy had risen to only $4.4 billion. This is no surprise; despite a decline in the number of employees, the industry has been forced to respond to a highly competitive environment for employees. Further, the average weekly wage is up nearly 3 percent, and the total annual wage is up about 3 percent. This is a marked improvement over retail wages for all US retail employees which have risen by a paltry 1.6 percent over the past 10 years.
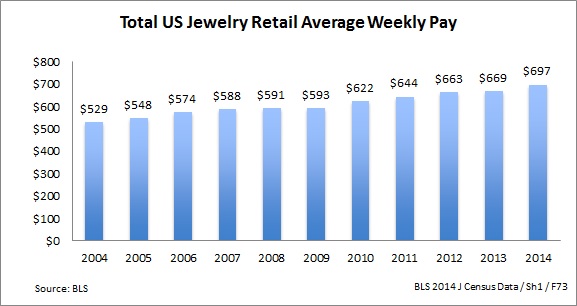
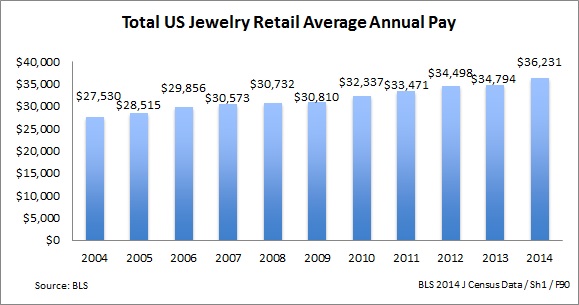
However, the average specialty jewelry employee makes just over $17 per hour or about $697 per week, which equates to about $36,000 per year. There are some jurisdictions – and at least one presidential hopeful – that want to raise the US minimum wage to $15 per hour. A “living wage” is in the mid-$30,000 range, according to several studies.
The graphs below illustrate wage trends in the US jewelry industry over the past 10 years.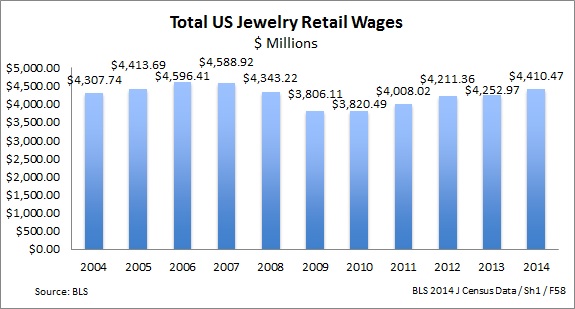
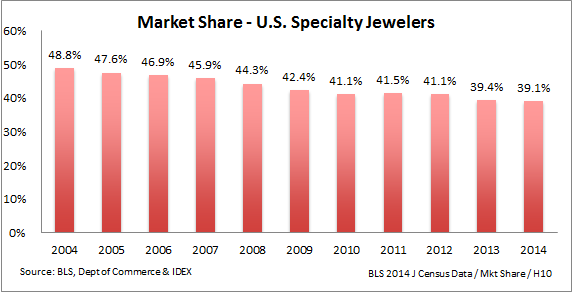
· Specialty jewelers in the US market are losing market share to multi-line merchants who sell jewelry. Over the past 10 years, total sales of fine jewelry and fine watches have increased to $78.1 billion from $56.6 billion, a 38-percent increase in the size of the market. Specialty jewelers’ sales have growth from $27.6 billion in 2004 to $30.5 billion in 2014, an increase of just over 10 percent. In 2004, specialty jewelers held a market share of about 49 percent; it dropped to 39 percent at the end of 2014, as the graph below illustrates.
Unless specialty jewelers can develop a convincing marketing strategy, we believe that they will continue to lose market share. Most other retail categories have consolidated to just a few “big” merchants. Specialty jewelry remains one of the last unconsolidated retail segments, but it is accelerating toward consolidation.
Good News: Jewelry Store Operating Efficiencies Improve
Despite these new statistics, which show that the specialty jewelry industry is losing stores, market share, and share of wallet, there is good news relating to store operating efficiencies. As jewelry demand continues to grow, there are fewer merchants vying for an expanding market. With diminished competition, the remaining jewelers should be able to generate greater sales and profit growth.
· As sales per store rise rapidly, relatively fixed costs are more efficiently absorbed, and profits should rise. Sales per store for specialty jewelers have risen by over 36 percent between 2004 and 2014. In 2004, the typical independent specialty jeweler generated sales per store of about $1.1 million; in 2014, that had risen to about $1.4 million, as the graph below illustrates. 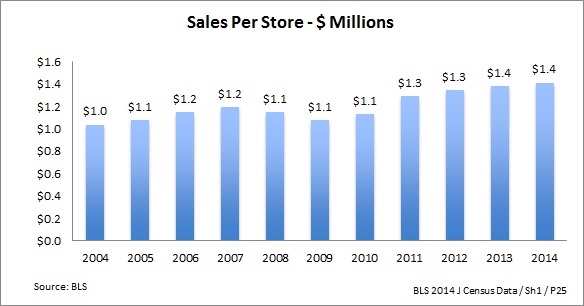
· Sales per employee are up sharply. Total specialty jewelry sales per employee – which includes all employees such as sales people, administrative support people and top officers – have grown by 42 percent in the 10-year period ended 2014. That is a dramatic increase in sales efficiency. The graph below illustrates sales per employee from 2004 through 2014.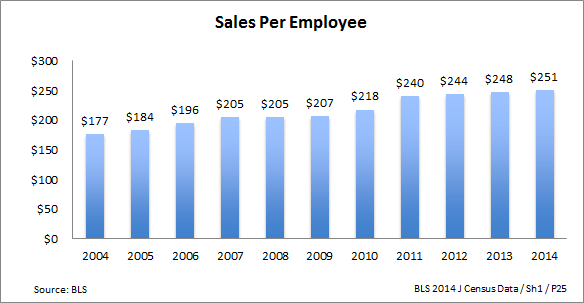
· · The number of employees per store has fallen over the past decade. In 2004, there were 5.9 employees per store. That number fell to 5.2 employees per store late in the decade as jewelers cut back due to the recession. It has now grown to about 5.6 employees per store in 2014. It shows that many jewelers were probably overstaffed prior to the recession. The graph below illustrates the number of employees per store for specialty jewelers in the US market.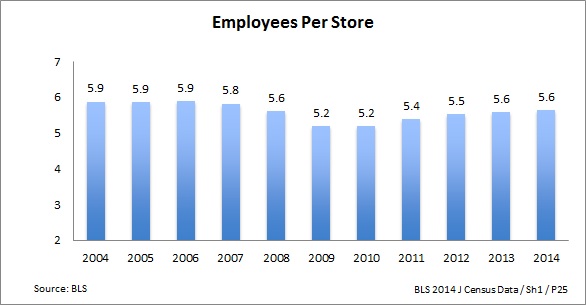
Conclusion
While there are many conclusions that can be drawn from the BLS data, we have highlighted five key points:
· The specialty jewelry industry has become a less important retailing segment in the American economy.
· While the American specialty jewelry industry has shown modest growth over the past decade, its growth rate is far below the growth of total retail sales in the US market.
· Unless specialty jewelers can develop a credible competitive differential, they will continue to lose market share to multi-line retailers.
· Specialty jewelry merchants who expect to sell high-ticket luxury goods to discerning shoppers will need to pay more to get qualified personnel.
· The “Great Recession” taught retail jewelers how to operate more efficiently.
The following table summarizes the latest government statistics for both the US jewelry industry as well as the total US retailing industry.
Year Retail Statistics - Summary 2004 2014 Percent Change 2014 vs 2004 TOTAL U.S. JEWELRY INDUSTRY STATISTICS Total Fine Jewelry & Watch Sales ($ Billions) $ 56.6 $ 78.1 38.1% Total Specialty Jewelers' Sales ($ Billions) $ 27.6 $ 30.5 10.5% Market Share of Specialty Jewelers 49% 39% (20.0%) Specialty Jewelers Number of Stores 26,642 21,599 (18.9%) Sales Per Store ($ Millions) $ 1.0 $ 1.4 36.3% Number of Employees 156,475 121,732 (22.2%) Total US Jewelry Retail Wages ($ Millions) $ 4,308 $ 4,410 2.4% Average Weekly Pay $ 529 $ 697 31.8% Average Annual Pay $ 27,530 $ 36,231 31.6% Sales Per Jewelry Employee $ 177 $ 251 42.0% Employees Per Jewelry Store 5.9 5.6 (4.0%) TOTAL U.S. RETAIL INDUSTRY STATISTICS Total US Retail Sales ($ Billions) $ 3,473.0 $ 4,632.3 33.4% Number Retail Stores 1,034,581 1,040,626 0.6% Number Retail Employees 15,060,686 15,345,353 1.9% Total Retail Wages ($ Millions) $ 367,702 $ 441,073 20.0% Average Weekly Pay $ 470 $ 553 17.7% Average Annual Pay $ 24,413 $ 28,743 17.7% COMPARISONS Jewelry Sales % of Total Retail Sales All Retail Merchants Selling Jewelry 1.6% 1.7% Specialty Jewelers 0.8% 0.7% Jewelry Stores % of Total Retail Stores 2.6% 2.1% Jewelry Wages % of Total Retail Wages 1.2% 1.0% Jewelry Employees % of Total Retail Employees 1.0% 0.8% Source: BLS & IDEX IDEX / 2014 J Census Data / Table / D20