Specialty Jewelers Post Solid Sales Gains in June
August 26, 15
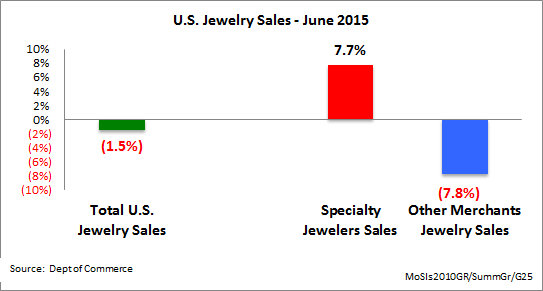
(IDEX Online News) – Specialty jewelers’ sales rose by a strong 7.7 percent in June to $2.3 billion, while jewelry sales at multi-line merchants declined by an estimated 7.8 percent, according to newly released data from the US Department of Commerce. As a result, total sales of fine jewelry and fine watches were down 1.5 percent in the US market in June to about $5.7 billion.
June data was somewhat of an aberration from the norm: usually specialty jewelers’ sales and jewelry sales at multi-line merchants move together – they are either both up or both down in a given month.
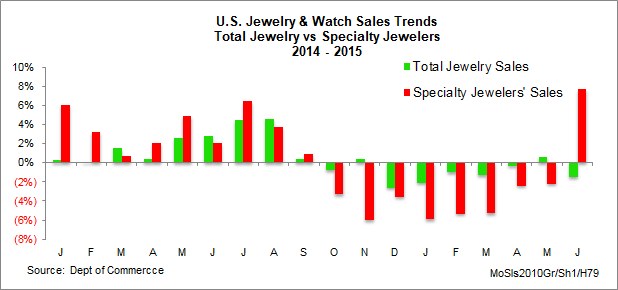
The graph below summarizes monthly year-to-year percentage changes in specialty jewelry sales trends (red bar) versus total US jewelry sales (green bar). As the graph clearly shows, some months show similar data, while other months show wide divergence.

In June, two key factors came together to affect the data: 1) the Commerce Department made a major revision in the “Total US Jewelry and Watch” data affecting monthly sales for the past four years and 2) June jewelry sales are modest, so any movement in the sales results in a large percentage change. Finally, it is important to understand that the Commerce Department summarizes the numbers from a sample of jewelers’ sales, and revisions occur regularly.
Is this unusually large spread between specialty jewelers’ sales and other merchants’ jewelry sales realistic? We’ve seen a divergence of jewelry sales trends in prior months – most recently last month (May) – when other merchants’ sales were up, but specialty jewelers’ sales were down. Some other months have shown substantial differences in jewelry demand between specialty jewelers – who generate about 41 percent of all US jewelry sales – and multi-line merchants who generate about 59 percent of the jewelry industry’s sales.
The graph below summarizes the difference in June sales performance between specialty jewelers and other merchants’ jewelry sales.

Given the dichotomy of the recent monthly sales data, it is probably better to look at a rolling three-month average of the data.