IDEX Online Research: U.S. June Jewelry Sales Lack Momentum (Full Analysis)
August 30, 10
After solid momentum in the first quarter of 2010, second quarter and June sales gains were more moderate. Jewelry gained market share – jewelry and watch sales advanced by over 6 percent while total retail sales were up by about 5 percent - but the gains were smaller than in prior months.
Here’s the scoreboard for June U.S. retail and jewelry sales:
Retail Category June 2010 Vs June 2009 Total Retail Sales – All Categories +5.3% Total Retail Sales – Ex-Auto & Food +5.1% Total Jewelry & Watch Sales +6.1% Total Jewelry Sales +6.3% Total Watch Sales +4.3% Total Specialty Jewelers’ Sales +3.1% Total “Other” Merchants’ Jewelry Sales* +8.9% Source: U.S. Department of Commerce
*Jewelry sales at all merchants not classified as “specialty jewelers” Includes Wal-Mart,
J.C. Penney, Kohl’s, Costco and others.
June Jewelry Sales Highlights
Highlights of June jewelry sales in the U.S. market include the following:
Total Jewelry Sales Slacken From Prior Months
During July, the Department of Commerce released its annual sales revision for total jewelry industry sales, so there was a restatement of all data beginning with 2007. Fortunately, the revisions were very minor this year. Last year, the Department of Commerce reduced total industry sales figures by nearly 10 percent for some years during the past decade; this year, the numbers moved less than 1 percent. Further, there were no changes in trends, other than to confirm what we already knew: 2009 was worse than previously reported. The revised data is shown at the end of this report.
· Total U.S. jewelry and watch sales rose by 6.1 percent in June, to an estimated $4.3 billion, up from a revised 8.5 percent gain in May (revised downward from +11.0 percent). June’s sales gain was the smallest this year. Year-to-date, total U.S. jewelry sales are up by about 8.2 percent, a solid gain even in the face of slowing momentum.
These figures include all jewelry and watches sold by any merchant – specialty jewelers, multi-line retailers, online sellers and any other retail channel. June’s jewelry and watch sales of $4.3 billion were up from March and April sales levels of about $4.0 billion each, but below the revised $5.2 billion in May. The incremental sales in May – roughly $1.2 billion – were due largely to demand for Mother’s Day jewelry.
The table below compares U.S. monthly jewelry sales in billions of U.S. dollars for the first six months of 2010 versus the same period in 2009. Due to rounding, the numbers may not foot and cross exactly.
| | Jan | Feb | Mar | Apr | May | Jun | YTD |
| 2009 | $3.0 | $4.6 | $3.5 | $3.8 | $4.8 | $4.1 | $23.8 |
| 2010 | $3.3 | $4.9 | $4.0 | $4.0 | $5.2 | $4.3 | $25.8 |
| % Chg | 9.8% | 7.1% | 12.3% | 6.3% | 8.5% | 6.1% | 8.2% |
Instore magazine’s “Brain Squad” respondents said they had good sales in June. About 50 percent of the jewelers reported that their sales were up during the month. About 24 percent said their sales were about flat, and 26 percent of their “Brain Squad” respondents said their sales were down in June.
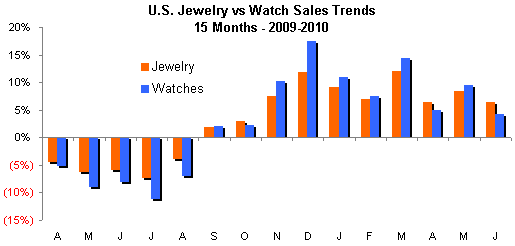
· Watch sales have generally been stronger than jewelry sales in 2010, but this is largely due to easy comparisons against 2009 watch sales, which were dismal. However, in June, watch sales slowed, and the sales gain was more modest than the sales gain for jewelry. During June, jewelry and watch sales were up 6.1 percent; jewelry was up 6.3 percent, while watch sales were up 4.3 percent, based on Department of Commerce data.
Sales figures from the LGI Network indicated that watch sales were up about 5 percent in June; this correlates closely with the Department of Commerce figures.
The graph below compares watch sales (blue bars) to jewelry sales (red bars).
 Source: US Dept of Commercce |
· The current annual run-rate for total jewelry sales in 2010 is $62.4 billion, based on Commerce Department figures. This is down from prior months’ projections as high as $64 billion, but it is above 2007’s record jewelry sales of $62.0 billion (revised), and it is ahead of our expectations. Prior to June, the annual run rate for U.S. jewelry sales had been rising modestly each month this year. Despite the slowing momentum in June, we remain optimistic.
Specialty Jewelers June Sales Slow
Specialty jewelers’ sales represent just under half of all jewelry sales in the U.S. on an annual basis. In June, they were $2.1 billion, about 48 percent of total industry sales of $4.3 billion.
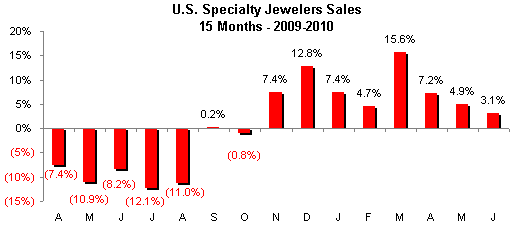
· Specialty jewelers posted a modest 3.1 percent gain in sales in June 2010 versus the same month a year ago. This was the smallest gain this year, and was well below the average gain for the first six months of 6.8 percent. However, in a recovery cycle, individual monthly sales comparisons can be volatile.
The graph below summarizes specialty jewelers’ monthly sales gains for the past 15 months. There is significant variation in the monthly sales gains since the recovery began in September 2009, as the graph illustrates. However, the trend for the past three months confirms that jewelry sales momentum has slowed.
 Source: US Dept of Commercce |
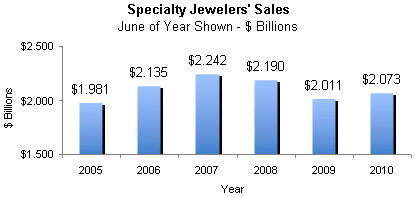
· Specialty jewelers’ sales rose to about $2.1 billion in June 2010, modestly above June 2009’s $2.0 billion. This was about in line with this year’s March and April sales levels of $2.0 and $2.1 billion, respectively, when there were no major sales events fueling demand. Further, June sales were well below sales in the $2.4-2.5 billion range for February and May, which have Valentine’s and Mother’s Day to help boost demand for jewelry.
It appears that the pace of U.S. jewelry sales has settled in at $2.0-2.1 billion per month, at least for the near term. This is roughly in line with sales for the month of June over the prior five years, as the graph below illustrates.
 |
· Looking ahead, monthly sales comparisons remain relatively easy for specialty jewelers through the summer. Beginning in September – the first month of the recovery cycle which began a year ago – monthly sales comparisons become more difficult. Thus, we expect more modest sales gains for specialty jewelers later this year. However, we caution that sales could be choppy until the U.S. economy shows solid signs of a sustained recovery.
Comparisons to Other Sectors
In most cycles, jewelry sales dip further than total retail sales, and rise faster during the recovery period. This has been the trend in 2010. Unfortunately, however, specialty jewelers have not participated in this recovery as much as other retailers who sell jewelry. Historically, specialty jewelers lose market share in a recession, and never regain it; this has occurred in the recession of 2008 and 2009.
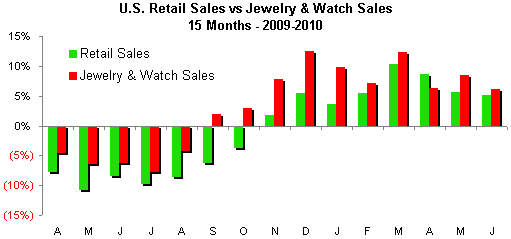
· Jewelry sales have shown greater gains than total retail sales every month this year. This indicates that jewelry is gaining market share – share of wallet – during the recovery period. As noted, this trend often occurs in a recovery period. The graph below illustrates jewelry sales trends (red bars) versus total retail sales trends (green bars).
 Source: US Dept of Commercce |
· Specialty jewelers continued to lose market share in June. In 2009, specialty jewelers ended the year with a 48 percent market share of all jewelry sold, down 80 basis points from the prior year’s 48.8 percent (all data has been revised to reflect new annual and monthly figures released in July 2010 by the government).
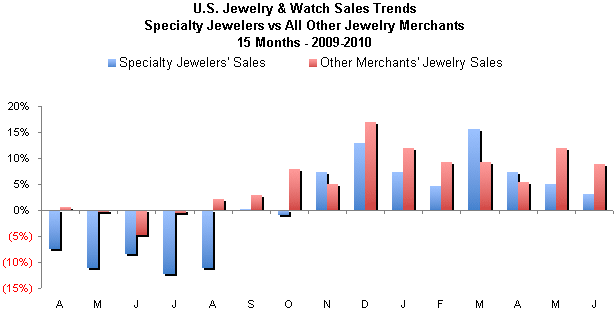
In January and February of 2010, specialty jewelers lost market share, but in March and April, the trend reversed. However, in May and June, specialty jewelers’ sales were notably below the industry average, indicating that they probably lost some market share overall.
The graph below summarizes sales gains by specialty jewelers versus other merchants who sell jewelry. Specialty jewelers’ sales trends are shown by the blue bars, while other merchants’ jewelry sales are shown by the red bars.
Source: US Dept of Commercce
Outlook: Brighter for Jewelry
While the recession brought about some changes in jewelry consumption in the U.S., we are seeing a “reversion to the mean” as the economy recovers. This is a mathematical expression that we’ve applied to consumer spending on jewelry: shoppers are continuing to revert to their pre-recession spending habits.
While jewelry sales gains could be choppy over the next few months – that’s normal in a recovery period – we expect to see signs of strength by the fourth quarter. While we don’t think jewelry demand will be booming for the all-important holiday selling period, we do believe that they will show solid mid-to-high single digit gains.
Despite dire reports that consumer spending trends will be forever altered, it simply doesn’t happen that way. Spending trends change very slowly – by evolution, not revolution. Further, the jewelry industry has 50,000 years of history during which demand for jewelry remained undiminished. How many times do we need to say this: The recession of 2008-2009 will not change consumers’ cultural affinity for jewelry.
Revised U.S. Jewelry Industry Sales Data
Each year, the Department of Commerce revises retail sales figures. During July, total jewelry industry sales were adjusted for 2007, 2008 and 2009 (monthly and annual figures); prior years were unadjusted. The adjustments were very modest – less than a 1 percent change in every case for the annual data. This is in contrast to last year when the Commerce Department slashed its estimate of U.S. jewelry industry sales from about $65 billion annually to about $60 billion, and adjusted sales for almost two prior decades.
The following table summarizes the most recent “original” U.S. jewelry industry sales estimates with revised sales data. All data is in billions of U.S. dollars.
| Year | Revised | Original | % Change |
| 2006 | $59.649 | $59.649 | No Change |
| 2007 | $61.959 | $61.635 | +0.5% |
| 2008 | $60.448 | $59.969 | +0.8% |
| 2009 | $58.831 | $59.033 | (0.3%) |