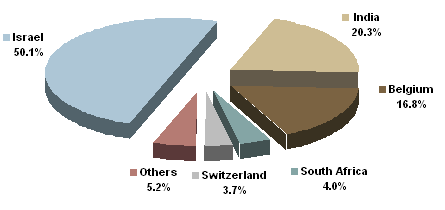
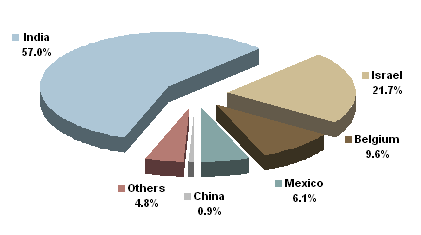
U.S. Polished Imports by Country, April 2007
June 10, 07
U.S. Polished imports for April by value and volume.
| Country | April, 2007 | ||||
| Value | Carat | Average | |||
| Israel | $607,018,816 | 229,340 | $2,646.81 | ||
| India | $246,085,764 | 601,708 | $408.98 | ||
| Belgium | $203,459,438 | 101,842 | $1,997.79 | ||
| South Africa | $48,196,710 | 6,279 | $7,675.86 | ||
| Switzerland | $45,081,744 | 2,133 | $21,135.37 | ||
| Russia | $14,386,210 | 6,810 | $2,112.51 | ||
| China | $9,954,339 | 9,133 | $1,089.93 | ||
| Mexico | $8,398,256 | 64,092 | $131.03 | ||
| United Arab Em | $6,192,630 | 7,582 | $816.75 | ||
| Canada | $4,802,582 | 1,644 | $2,921.28 | ||
| Hong Kong | $4,119,820 | 4,705 | $875.63 | ||
| Thailand | $2,542,474 | 8,424 | $301.81 | ||
| Indonesia | $1,742,274 | 115 | $15,150.21 | ||
| United Kingdom | $1,648,919 | 309 | $5,336.31 | ||
| Australia | $1,561,035 | 1,099 | $1,420.41 | ||
| Mauritius | $1,505,411 | 861 | $1,748.44 | ||
| Italy | $983,566 | 227 | $4,332.89 | ||
| Dominican Rep | $715,521 | 7,145 | $100.14 | ||
| Guyana | $539,842 | 462 | $1,168.49 | ||
| Namibia | $539,042 | 136 | $3,963.54 | ||
| Singapore | $492,524 | 46 | $10,707.04 | ||
| Taiwan | $390,507 | 9 | $43,389.67 | ||
| France | $330,918 | 32 | $10,341.19 | ||
| Lebanon | $288,518 | 177 | $1,630.05 | ||
| Germany | $255,259 | 149 | $1,713.15 | ||
| Japan | $252,589 | 116 | $2,177.49 | ||
| Netherlands | $227,377 | 95 | $2,393.44 | ||
| Spain | $221,250 | 10 | $22,125.00 | ||
| Botswana | $163,958 | 81 | $2,024.17 | ||
| Vietnam | $156,362 | 1,557 | $100.43 | ||
| Brazil | $27,540 | 142 | $193.94 | ||
| Armenia | $14,301 | 34 | $420.62 | ||
| Korea | $8,989 | 7 | $1,284.14 | ||
| Turkey | $2,648 | 4 | $662.00 | ||
| Total | $1,212,307,133 | 1,056,505 | $1,147.47 | ||
| 2006 Total | $1,117,600,358 | 1,149,577 | $972.18 | ||
| difference | $94,706,775 | -93,072 | $175.29 | ||
| % | 8.47% | -8.10% | $0.18 | ||
| Imports for April by Value |
| Imports for April by Carat |