IDEX Online Research: Americans Love Gold Jewelry
June 11, 07
The laws of supply and demand say that when the price of a commodity moves up, demand falls. The problem is that this is a theoretical law. It may have been credible when it was formulated, but the creator of the law of supply and demand never met an American shopper.
When American consumers want something badly enough, they will buy it. They will rationalize the decision, they will figure out a way to justify the purchase.
That’s what happened in the gold jewelry market in the United States during 2006. The average price of gold rose by nearly 36 percent between 2005 and 2006. But, instead of sales declining, gold jewelry demand strengthened in the U.S.
The total number of pieces sold rose by 5 percent, and the average price per piece rose by 1 percent. Total gold jewelry sales rose by just over 6 percent, as measured by dollars through the cash register (that’s the ultimate measure for merchants!). Gold tonnage used in jewelry was reported to be down 12 percent to 16 percent (depending on whose numbers you believe) in 2006, but this largely had to do with pipeline and inventory issues.
On the other hand, we should not be surprised at American consumption trends. When Americans develop an affinity for a commodity, they seem to keep buying, despite the price. In fact, some economists have seen a new trend among shoppers: when the price rises, consumers clamor even harder for the goods.
Why? It could be anticipatory buying, which occurs when people think the price will rise even higher. It could be a signal that a scarcity might develop, so consumers want to lay in a supply, for both their own use as well as perhaps for “investment.” It could be that consumers see today’s price as a “value”, compared to the potential of a higher price tomorrow.
The best example of strengthening demand, despite rising prices, is at the gasoline pump. Gasoline prices have risen by about 50 percent since late 2006 – to over $3 per gallon from $2 per gallon just a few months ago. Not only is seasonal demand up, but “core” demand for gasoline has risen faster than predicted, indicating that Americans are, in fact, taking longer and/or more trips than ever before.
The lesson to be learned here is this: When an American shopper gets a notion to buy something, nothing will stand in his or her way.
U.S. Gold Jewelry Sales Reach Record Level
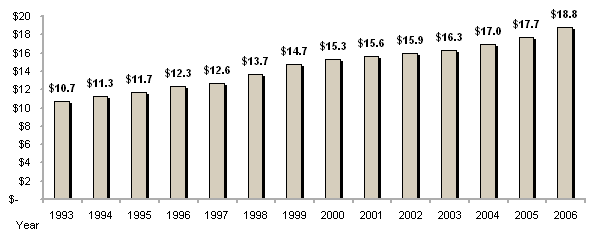
During 2006, the World Gold Council reported that gold jewelry sales reached a record $18.8 billion, up 6.1 percent from 2005’s $17.7 billion. This represents the value of the gold used in all jewelry.
The graph below illustrates gold jewelry sales trends between 1993 and 2006 in the U.S. market.
| U.S. Gold Jewelry Sales |
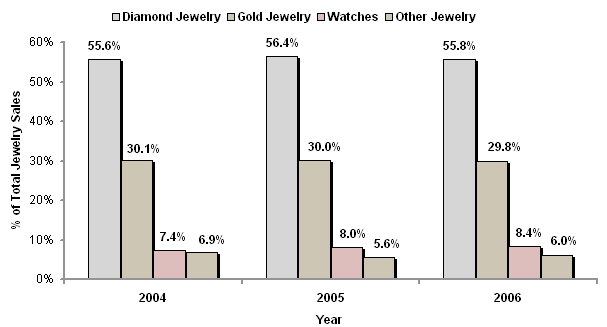
After diamonds and diamond jewelry, gold jewelry is the second most important product category, based on sales, for American jewelers. The graph below summarizes the relative proportion of the market that gold jewelry holds versus other major categories.
| U.S. Jewelry Sales - Percent of Total |
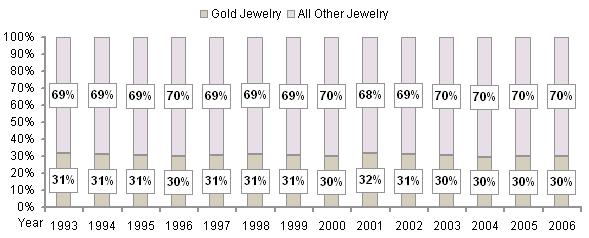
Gold jewelry, with 2006 sales of $18.8 billion, has about a 30 percent market share of the total U.S. jewelry market of $63.1 billion. This market share level has held steady for the past four years. Since early in the 1990s, gold jewelry had held a consistent 30-31 percent market share. Most other jewelry categories have lost market share to diamonds. Further, with sharply rising gold prices, logic would suggest that gold jewelry would be expected to lose market share. However, as a testimony to the success of promotional programs by the World Gold Council, gold jewelry remains an American favorite with stable market share.
The graph below summarizes the long term trend of gold jewelry’s market share in the U.S. market.
| U.S. Market - Gold Jewelry Sales Mix |
Demand for Gold Jewelry Softer Than Demand for Total Jewelry
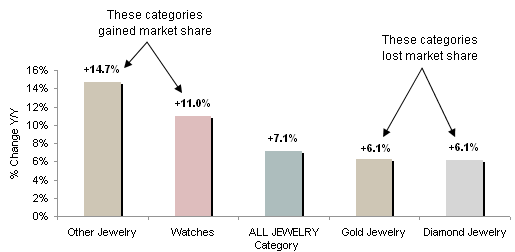
Interestingly, while gold jewelry demand has remained strong and held a steady 30 percent market share in 2006, it, along with diamond jewelry, lost a modest amount of market share last year. The market share loss for gold jewelry was only about 30 basis points (versus the prior year), an inconsequential amount in the big picture of the U.S. jewelry industry.
The graph below illustrates market share gains and losses for major jewelry categories in 2006.
| U.S. Market - 2006 Sales Growth Trends |
Gold Jewelry Demand Correlates with Demand for All Jewelry
In general, when demand is strong for the total jewelry category, gold jewelry also participates. When demand for all jewelry falters, gold jewelry demand usually suffers, too.
The following graph illustrates demand trends for both gold jewelry and total jewelry (diamonds, gemstones, precious metals, watches and all other categories).
U.S. Jewelry Sales Trends
Gold Jewelry vs All Jewelry
1994 - 2006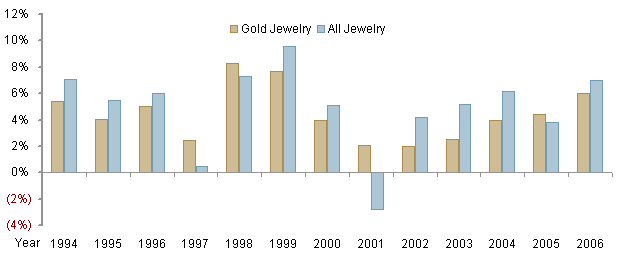
Source: World Gold Council
U.S. gold jewelry sales growth lagged total jewelry sales growth in 2006
Gold Jewelry Demand Is Less Volatile Than Gold Prices
It should come as no surprise that demand for gold jewelry at the retail level does not move lock-step with the price of gold, though the argument is typically made by economists that the laws of supply and demand would dictate that there should be a direct correlation between gold prices and gold jewelry demand.
The quick answer to this dilemma is that there is a disconnect between gold prices and the retail price of gold jewelry. For a variety of reasons, both gold suppliers and gold jewelry retailers absorb some of the bumps in the pricing model. None-the-less, with gold prices soaring in 2006, we would have expected to see more of an impact on gold jewelry demand.
The graph below summarizes the annual price of gold since 1993. The price spike of 2006 is clear on the graph.
| Gold Price |
The following graph illustrates the lack of correlation between swings in the price of gold and demand for gold jewelry. Gold prices experience violent swings, but demand for gold jewelry appears to be more stable.
U.S. Jewelry Sales Trends
Gold Jewelry vs Gold Price
Percent Change - Year-to-Year
1994 - 2006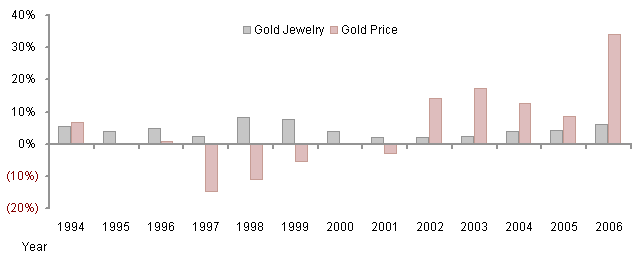
Source: World Gold Council
U.S. gold jewelry sales growth in 2006 was well below the increase in gold prices
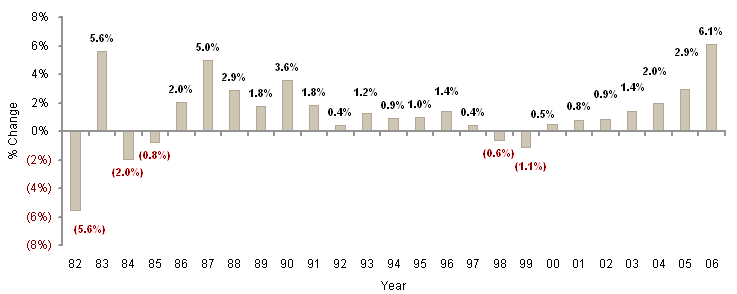
While the U.S. Department of Commerce does not provide a separate Producer Price Index for gold jewelry, it summarizes producer price trends for all categories. Because gold jewelry represents nearly one-third of all industry revenues (at retail), we would expect to see the impact of higher gold prices on the Producer Price Index. Clearly, that did not happen. Why? Gold jewelry producers absorbed some of the higher gold prices during 2006.
The graph below summarizes the Jewelry Producer Price Index for the past 25 years.
| U.S. Producer Price Index |
