IDEX Online Research: Consumer Demand Has Not Dried Up
November 19, 08
Two headlines grabbed our attention this week. The Associated Press reported, “Retail sales plunged” in October. The other, reported by another jewelry industry publication, came from the National Retail Federation which said, “Consumers went into hibernation” in October. There is a problem with these headlines: neither is true.
If you read further into each of these news stories, here’s what you will find:
- National Retail Federation – “According to the National Retail Federation, retail industry sales for October (which exclude automobiles, gas stations, and restaurants) decreased 0.5 percent seasonally adjusted from September while increasing 1.3 percent unadjusted year-over-year.”
- Associated Press – “The Commerce said that retail sales fell by 2.8 percent last month.”
Our dictionary defines “plunge” as “to fall precipitously and uncontrollably.” It defines “hibernation” as “a dormant or inactive state.” Neither “plunge” nor “hibernation” seem to describe what actually happened to U.S. retail sales in October, based on the information in the story.
Here’s what really happened:
- U.S. retail sales declined by a low single digit number – less than 3 percent – depending on whose numbers you use and whether they are seasonally adjusted or not.
- U.S. consumers spent $360 billion on retail goods versus $372 billion last year, as measured by dollars through the cash register (not seasonally adjusted).
If you are an optimist and you see the glass as half full, rather than half empty and rapidly draining, you could also accurately state the following:
- U.S. retail sales in October were about 97 percent of last year’s level. On a per-household basis, consumer spending in October 2008 was about $2,813 versus about $2,953 last year. In short, the typical U.S. family reduced its monthly expenditures by $140 in October 2008 versus the same period in 2007.
The problem is that the facts don’t sell newspapers: fear sells, and the media is doing its best to instill fear and uncertainty into U.S. consumers.
We’ve said it before: just because you see something in print, it does not automatically mean that it is true. Much of the economic news in the media today qualifies as fiction, not fact.
September Jewelry Sales Weaken
Demand for big ticket goods by U.S. consumers was weak in September 2008, and jewelry was no exception. For the month, total jewelry industry sales were essentially flat against the same period last year. However, specialty jewelers’ sales declined modestly, primarily in response to a reduction in shopping mall traffic.
If the government’s preliminary advance retail sales numbers for October are any indication, jewelry sales in October will likely show a greater disappointment. Unfortunately, the government reports jewelry sales with a two-month lag, while other major retail sales categories are reported shortly after the close of the month. October jewelry sales results will be available from the Department of Commerce in mid-December.
The table below summarizes September jewelry sales as well as total retail sales (all categories) in the U.S. market. Sales data are measured as “dollars through the cash register” and are not “seasonally adjusted” nor have they been adjusted for inflation.
September 2008 – Monthly Sales Trends
- 0.0% - Total U.S. Jewelry Sales (Flat Y/Y)
- (3.5%) - Total U.S. Specialty Jewelers’ Sales
- (0.1%) - Total U.S. Retail Sales (All Categories)
- +4.5% - Total U.S. Retail Sales (Ex-Auto & Food)
These numbers represent a gradual weakening of both retail demand and jewelry demand that the U.S. market has experienced over the past several months. The table below summarizes key sales trends for the prior three months.

Source: Various
From a realist’s point of view, here’s what we can accurately say about September jewelry sales:
- U.S. consumers spent the same amount on jewelry in September 2008 as they did in September 2007. Specialty jewelers’ September sales were 96.5 percent of last year’s levels, a modest drop. (Our dictionary defines “modest” – in this context – as a small reduction. We think that is an accurate term.)
So far, three publicly held jewelers have reported their sales trends for the third fiscal quarter ended October. Their numbers are disappointing:
- Finlay – Total sales up 12.9 percent (true, but distorted by acquisitions); same-store sales down 13.5 percent.
- Sterling Jewelers (U.S. division of Signet Group) – Total sales down 4.3 percent; same-store sales down 7.9 percent.
- Birks & Mayors (U.S.) – Third quarter same-store sales in the U.S. were down 6 percent for Birks & Mayors, the high-end jeweler.
- Several other jewelers will report results prior to or just after Thanksgiving.
While the public companies have reported disappointing results, all is not bleak in the jewelry industry. Based on our sample of independent jewelers (which includes one-store units up to nearly 100-store chains), some jewelers are posting sales gains – at double-digit levels, in a few cases. So, don’t go around saying “everyone is doing poorly” – that, too, would be fiction, and you don’t want to be tossed into the same camp as the media!
High-End Jewelry Sales Weaker Than Expected
Typically, high-end jewelry sales remain strong during recessionary period. But we are hearing more upper-end jewelers fret about sales weakness. We think there is a key reason for this:
- There’s a big difference between the spending habits of “old money” versus the spending habits of “new money.” – About 16 percent of all U.S. households have income levels of $100,000 or greater per year, based on the latest data (2006). Those households account for 46 percent of total jewelry industry sales. Their jewelry expenditures per household are dramatically higher than lower income households.
These high-income households are comprised of two types of consumers: “old money” and “new money.” The spending habits of “old money” households versus “new money” households are vastly different.
- New money – Estimates suggest that at least half of all households with annual income levels above $100,000 are “new money” – that is, money made in the past decade or two. And, most of these “new money” households made their money from either the stock market, real estate, or a combination of the two. With both of these asset-heavy categories under siege, these “new money” households have tightened their spending dramatically. Many of them have never been through a recession, and they have panicked.
- Old money – The “old money” households – those who inherited their money from wealthy ancestors and have invested it wisely – have generally continued to spend at their historic pace, though the fact that both the stock market and real estate have lost value may have curbed their spending by some degree. But there are simply not enough “old money” households to make a difference to the jewelry industry.
In addition, we are hearing a litany of excuses that we’ve not heard in the past, concerning consumers’ unwillingness to spend. For example, we recently heard that high-income consumers still have wealth, but they are using their wealth to help their children through this rough patch in the economy. We’ve also heard that they are putting their cash into the stock market; with so many stocks at historic low valuations, they are scooping up bargains. They say the only way they’d give up on the stock market is if American capitalism seemed doomed, and that’s simply not the case, they assert.
Jewelry Sales Forecast Revised Downward
As new data rolls in from a rapidly changing marketplace, our sales forecast continues to evolve.
Based on all of the forces which are bringing pressure on the consumer sector of the economy, we are revising our jewelry sales forecast for the U.S. market in 2008 to a decline of 0.3 percent. Previously, we were forecasting sales to be in the range of about +2.0 percent. That was down from earlier forecasts of +2.8 percent to 3.0 percent.
We continue to believe that holiday sales will be down in the low single digit range. Our sense is that October is likely to be the worst month, and while demand will be weak in November and December, it will not reflect “end-of-the-world” weakness.
September Jewelry Sales Weak
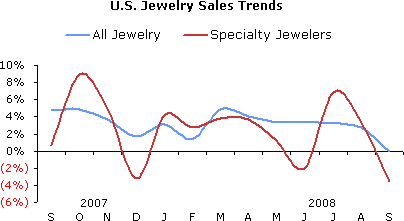
The total market for jewelry in the U.S. was static in September; sales were flat year-over-year. This is a continuation of a slowing sales trend which began in the first quarter of 2008 (see blue line on the graph below). Specialty jewelers posted a notable sales decline of 3.5 percent for the month.
The jewelry industry gained a slight amount of market share when compared to all retail categories. Total retail sales (all goods, including food and automobiles) posted a very modest decline – 0.1 percent – in September, dragged down by extremely weak auto sales. Total retail sales, excluding food and automobiles, were up by a relatively solid 4.5 percent in August. However, specialty jewelers lost market share during the month.
We also note that August jewelry sales for specialty jewelers were revised modestly upward. The preliminary numbers showed that August specialty jewelry sales rose by 3.2 percent; they were just revised to show a gain of 3.3 percent.
The graph below compares specialty jewelers’ sales trends (red line) to total jewelry sales trends (blue line) in the U.S. market. As the graph clearly illustrates, jewelry sales at specialty jewelers have been on a roller coaster ride for the past few months, with a sharp slide in September 2007, a spike in October, another slide in November and December, followed by a modest recovery in January, a small dip in February, and a modest recovery in March and April. In May, jewelry sales gains weakened substantially, followed by a major drop in June. July sales for specialty jewelers rose significantly; we believe this is an aberration, and we continue to look for further revisions on the downside over the next few months.

Source: US Dept. of Commerce
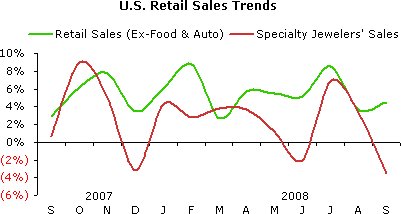
The graph below summarizes sales trends for all retail goods (green line) excluding food and automobiles versus specialty jewelers’ sales (red line). When food and auto sales are excluded, the remaining retail categories posted a sales gain of 4.5 percent in September. When food and auto sales are included, retail sales were down 0.1 percent for the month, as previously indicated.
Why do we eliminate “automobile” sales? Monthly auto sales are driven largely by consumer incentives rather than by underlying economic factors. Over the long term, auto demand trends are an important indicator of consumer vitality; however, on a month-to-month basis, auto demand is dependent on manufacturers’ incentives such as zero percent financing, cash-back offers and other deals. Food sales are far less cyclical and can mask changes in consumer demand; thus, we eliminate them, too.

Source: US Dept. of Commerce
Consumer Spending Continued to Slow in September
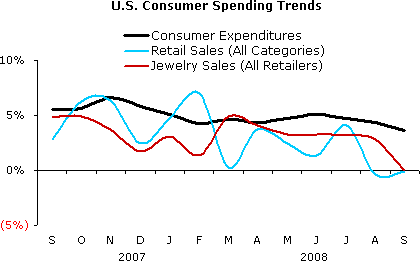
As inflation has slowed, growth of consumer expenditures has slowed from the first half of 2008. During September, consumer expenditures for all goods and services rose by 3.6 percent over the prior year. This represents a steady decline since June’s 5.1 percent gain, a point when the fires of inflation were most threatening.
What is driving the slowing of consumer expenditure growth? As the graph below shows, total retail sales growth took a dive in August and September, with spending on big ticket durables – often financed on credit – suffering the most. Consumer expenditures on services remain more-or-less on track, with little monthly deviation.
The graph below summarizes trends in American’s total spending (black line), retail sales of all goods (blue line) and expenditures on jewelry (red line). It is clear that dismal automobile sales in the U.S. market are having a dramatic negative impact on total retail sales (blue line). Automobile sales in 2007 were just over 20 percent of total retail sales; thus, it is clear why they have such an impact on total retail sales trends. And, it should be obvious why we typically eliminate them, when we analyze U.S. retail sales. Automobile sales are driven largely by the “deal-of-the-day,” as we noted above.

Source: US Dept. of Commerce
Jewelry Sales Forecast Revised Downward Again
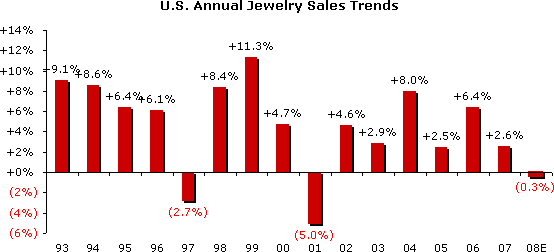
Because of strengthening headwinds and new data, especially in the consumer sector of the economy, we have revised our prediction for jewelry demand in the U.S. market. Earlier this year, we were looking for growth in the range of 2.8 percent to 3.0 percent for the full year. Last month, we revised our forecast to a gain in the 2.0-2.2 percent range. We now believe that U.S. jewelry sales will be down very modestly this year.
It is important for jewelers to understand that this gain is based on “dollars through the cash register” at the retail level. When jewelry price inflation is removed, jewelry sales in terms of units will likely be down about 7-8 percent for the full year.
How bad is an 8 percent decline in sales? It’s not so bad if you think of it these terms: you’ll still have 92 percent of your sales for the year. So, how do you look at it: is the glass half full or half empty? Are you part of the problem or part of the solution?
The graph below summarizes jewelry sales trends for the past 15 years in the U.S. market. It also shows our new forecast for the full year (far right open red bar).

Source: US Dept. of Commerce & IDEX Online
Postscript: Is There A Credible Newspaper?
Our choice for balanced global business news is the Financial Times; it covers the world’s markets better than the Wall Street Journal, in our opinion. Further, the Financial Times is less “sensationalist” with its news than other business newspapers.
Our choice for a broad variety of news is the Washington Post. This unabashedly liberal-leaning paper presents the most balanced business news of any paper we read. Like the Financial Times, it stays away from sensationalism. While its editorial pages are liberal, its news pages typically present both sides of major stories. That’s good journalism: let the reader make up his/her mind.
In short, both the Financial Times and the Washington Post report “the facts, just the facts” better than almost any other newspaper in our sample.