U.S. Polished Imports for January 2007
March 11, 07
U.S. Polished Imports for January by Value and Volume
| Country | January 2007 | ||||
| Value | Carat | Average Price per Ct | |||
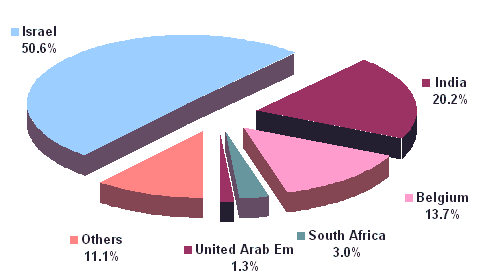
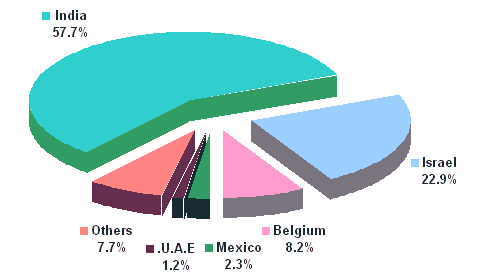
| Israel | $765,947,044 | 331,719 | 2309.02 | ||
| India | $306,249,829 | 833,514 | 367.42 | ||
| Belgium | $207,995,103 | 119,092 | 1746.51 | ||
| South Africa | $45,873,845 | 5,576 | 8227.02 | ||
| United Arab Em | $20,225,366 | 17,472 | 1157.59 | ||
| Switzerland | $18,702,728 | 1,850 | 10109.58 | ||
| United Kingdom | $15,471,532 | 4,638 | 3335.82 | ||
| Russia | $10,978,545 | 5,141 | 2135.49 | ||
| Hong Kong | $10,331,524 | 16,115 | 641.11 | ||
| China | $9,870,703 | 8,312 | 1187.52 | ||
| Australia | $6,193,900 | 822 | 7535.16 | ||
| Canada | $4,526,105 | 1,309 | 3457.68 | ||
| Mexico | $4,291,975 | 33,023 | 129.97 | ||
| Brunei | $2,456,875 | 10 | 245687.50 | ||
| Thailand | $2,144,300 | 6,327 | 338.91 | ||
| Mauritius | $1,643,261 | 762 | 2156.51 | ||
| Singapore | $1,456,200 | 285 | 5109.47 | ||
| Namibia | $1,053,214 | 716 | 1470.97 | ||
| Taiwan | $691,033 | 64 | 10797.39 | ||
| France | $657,248 | 367 | 1790.87 | ||
| Italy | $626,802 | 2,678 | 234.06 | ||
| Germany | $494,103 | 254 | 1945.29 | ||
| Cen African Rep | $488,000 | 912 | 535.09 | ||
| Dominican Rep | $379,386 | 3,799 | 99.86 | ||
| Netherlands | $259,023 | 39 | 6641.62 | ||
| Lebanon | $226,000 | 87 | 2597.70 | ||
| Japan | $164,942 | 1,280 | 128.86 | ||
| Colombia | $124,508 | 342 | 364.06 | ||
| Brazil | $43,557 | 30 | 1451.90 | ||
| Venezuela | $27,862 | 52 | 535.81 | ||
| Panama | $27,000 | 1 | 27000.00 | ||
| Costa Rica | $16,310 | 15 | 1087.33 | ||
| Bolivia | $4,243 | 3 | 1414.33 | ||
| Bulgaria | $3,563 | 10 | 356.30 | ||
| Vietnam | $125,949 | 1,659 | 75.92 | ||
| Total | $1,439,771,578 | 1,398,275 | $1,029.68 | ||
| 2006 Total | $1,277,457,651 | 1,485,412 | 860.00 | ||
| difference | $162,313,927 | -87,137 | 170 | ||
| % | 12.71% | -5.87% | 19.73% | ||
| U.S. Polished Imports by Dollar Value |
| U.S. Polished Imports by Carat |

