America's Best Jewelry Market Niches
October 09, 06
| |
Why Analyze Total Buying Power By Market Niche?
Why would a jeweler be interested in the buying power of a market segment? The primary reason is for marketing and advertising purposes. Aside from direct one-to-one marketing (direct mail, for example), it is difficult to identify and reach the “best” jewelry customer with mass media; the distinctions are too subtle and nuanced.
However, if jewelers can identify a large market niche, which can be reached by one or more media, it is possible that they would be better off accepting a smaller average ticket (lower per-household jewelry expenditure), but generate greater aggregate revenues by reaching many more consumers. In addition, jewelers’ profits could be larger since lower-priced jewelry generally carries a higher gross margin.
Market Niches by Demographic Factors
 |
Markets are segmented by the same demographic factors as individual consumers. That’s logical, since market segments are comprised of groups of individual consumers.
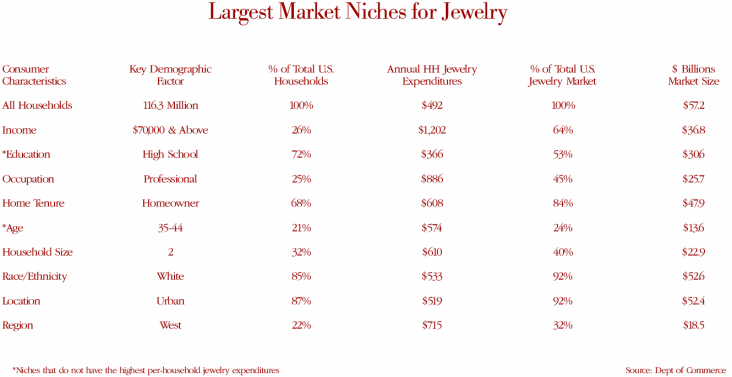
To arrive at the aggregate buying power or market potential of a market segment, we multiplied the average annual household jewelry expenditure by the total number of households in each demographic category. Thus, it is possible that a target market may not have the highest average annual jewelry expenditure, but if the group is disproportionately large, the combination of the average annual expenditure multiplied by the total consumer units may yield a very large target market.
The table over the page summarizes the largest market niches for jewelry. For all demographic categories except education and age, the largest aggregate market is also the market with the highest per-household annual jewelry expenditures.
- In the case of age, the average annual household expenditure for 35-to-44 year olds, as shown on the table, is $574. This is the third largest per-household jewelry expenditure. Both 25-to-34 year olds and 55-to-64 year olds have larger per-household jewelry expenditures, but their total market niches – per-household spending multiplied by total number of households – are smaller in terms of total jewelry sales volume.
- Likewise, consumers with only a high school education spend a modest $366 per year on jewelry, well below both the national average of $492 per-household jewelry expenditure and far below the $818 per-household jewelry expenditure of college-educated consumers. But there are a disproportional number of households (72 percent of all American households) with only a high school education; thus, their total jewelry expenditures, as small as they are on a per-household basis, add up to a majority of the aggregate market (53 percent).
The difference in market segmentation by “total market size” versus “highest average ticket,” can be illustrated by a comparison between Zale Corporation (Zales, Bailey Banks & Biddle, Gordon’s, Peoples, and others) and Sterling Jewelers (Kay, Jared, and other regional brands).
-
Sterling Jewelers seems to focus on targeting the largest market possible and generating the greatest number of sales. Sterling management appears to be much less focused on the size of the average ticket. As a result, Sterling’s average ticket is below Zale’s average ticket. But - and this is the important point - Sterling’s sales per store are significantly higher than Zale’s sales per store. In other words, Sterling is focused on generating the greatest total sales volume and appears to target the market that will yield the largest total jewelry sales, with less regard for the average per-household spending and average ticket.
- Zale seems to focus on the average ticket size. During its conference calls with Wall Street, management touts the size of its average ticket. Because of its goal of creating the highest average ticket, it would appear that Zale is focused on per-household jewelry spending, causing it to target the highest spending households with less regard for total market size. While jewelry expenditures per household are an important consideration - a larger ticket helps to more efficiently absorb overhead costs - it has yielded lower per-store sales levels for Zale, when compared to Sterling. As a result of lower per-store sales, Zale’s pretax margin is about half that of Sterling’s.
 |
